Tag: wim grommen

  • Dow Jones index zegt niets over economie

    Dow Jones index zegt niets over economie

    Vorige week sloot de Dow Jones voor het eerst in de geschiedenis boven de 20.000 punten. Een symbolische mijlpaal, want deze 121 jaar oude index zegt vandaag de dag nog maar weinig over de stand van de economie. Dat komt niet alleen omdat de samenstelling van bedrijven in de index door de jaren heen sterk verandert, maar ook door de manier waarop de score berekend wordt.

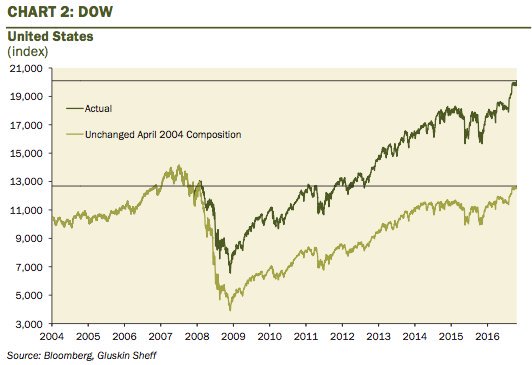
    Zou je de Dow Jones index vandaag de dag op dezelfde manier waarderen als in april 2004, dan kom je uit op een score van minder dan 13.000 punten. Dat is 1/3 minder dan de 20.000 puntengrens die inmiddels doorbroken is. Hoe kan dit verschil zo groot zijn? En hoe wordt deze beursindex eigenlijk berekend?

    dowjones-index

    Dow Jones index gewaardeerd volgens de berekening van 2004

    1. Samenstelling Dow Jones index

    De Dow Jones index bestaat van oudsher uit dertig verschillende bedrijven, waarvan ongeveer twee derde deel productiebedrijven. De rest een mix is van bedrijven uit andere belangrijke sectoren, zoals informatietechnologie, financiële dienstverlening en entertainment. Toch wordt de samenstelling van deze index zeer regelmatig aangepast. Wim Grommen schreef begin 2014 het volgende over de veranderingen van de index:

    In minder dan 10 jaar tijd zijn 12 van de 30 bedrijven in de Dow Jones vervangen, dat is 40%. Over een periode van 16 jaar werden 20 bedrijven vervangen, dus 67%. Na 16 jaar wordt dus de waarde van een mandje appels vergeleken met de waarde van een mandje peren.

    Vergelijk je de index van nu met die van 10, 20, 40 of 100 jaar geleden, dan vergelijk je steeds een compleet andere groep van bedrijven. En die veranderingen waren niet geheel willekeurig, want door de jaren heen is er een duidelijk trend waarneembaar. Zo worden bedrijven die uitgegroeid zijn en die op de beurs slecht presteren stelselmatig uit de index gehaald om plaats te maken voor bedrijven die meer groeipotentieel hebben.

    Koop je als belegger vandaag alle aandelen uit de Dow Jones index, dan is de kans groot dat over tien of twintig jaar een groot aantal van die bedrijven uit de index vervangen is door bedrijven met meer groeipotentieel. Het rendement van het mandje aandelen dat je destijds gekocht hebt zal daardoor waarschijnlijk lager zijn dan het rendement van de (aangepaste) index.

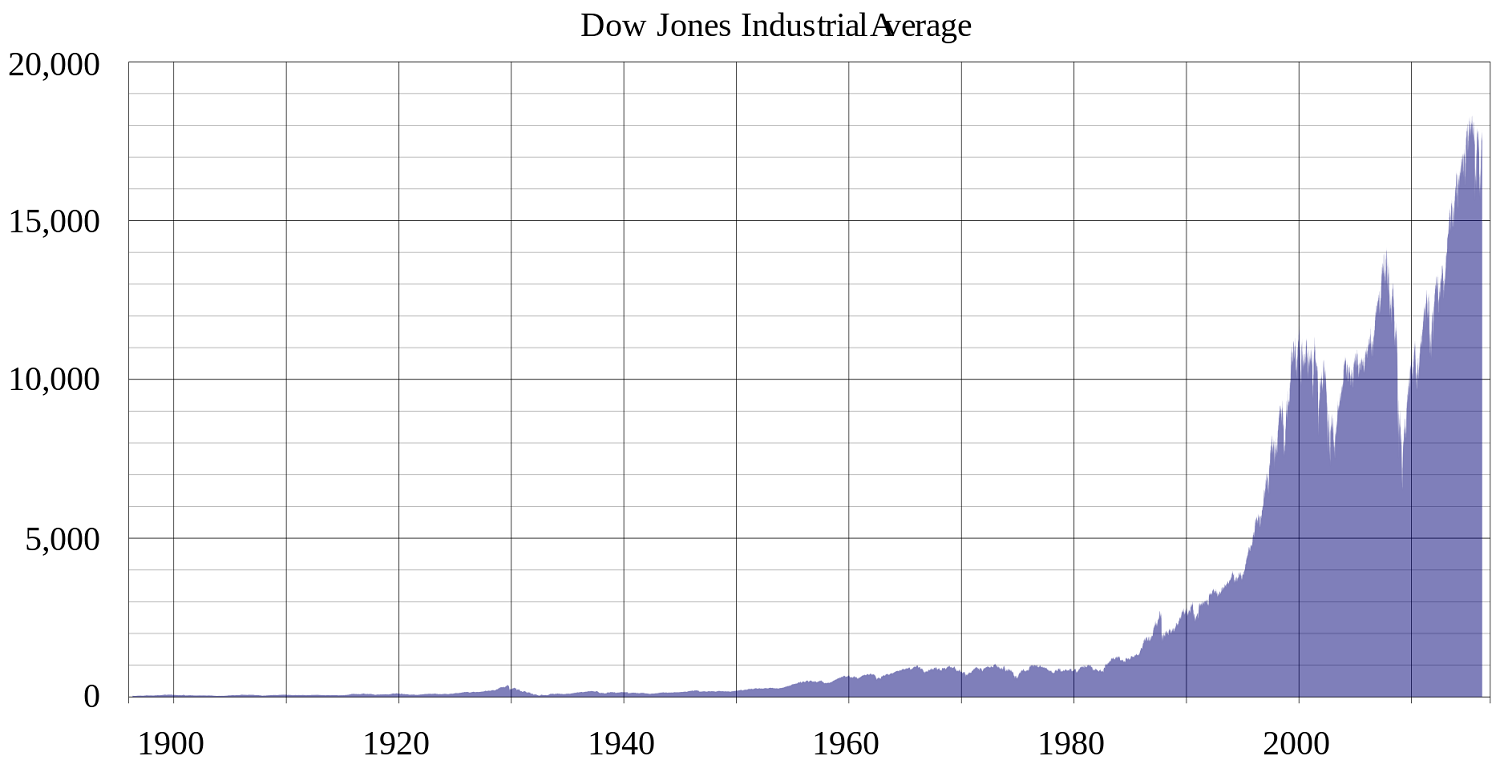
    DJIA_historical_graph.svg

    Historische ontwikkeling Dow Jones index (Grafiek via Wikipedia)

    2. Aanpassing formule

    Niet alleen de bedrijven die in de Dow Jones zitten worden met enige regelmatig gewisseld, ook wordt de berekening steeds aangepast. In het begin was de score van de Dow Jones simpelweg het bedrag in dollars dat je nodig had om van ieder bedrijf uit de index één aandeel te kopen. Maar door splitsing van aandelen en de uitkering van dividend werd de index erg onvoorspelbaar. Om dat op te vangen werd de Dow Divisor in het leven geroepen, zodat de score van de index gelijk bleef als een aandeel gesplitst werd of als bedrijven uit de index vervangen werden voor nieuwe bedrijven. Omdat er de afgelopen decennia zoveel aandelensplitsingen hebben plaatsgevonden binnen de Dow Jones index is deze deelfactor inmiddels een vermenigvuldigingsfactor geworden. Het resultaat is dat de Dow Divisor vandaag de dag nog maar 0,146 is, wat betekent dat de index met iedere dollar stijging van een aandeel met 6,85 punten omhoog schiet. Nu begrijpt u ook waarom de index de afgelopen decennia zo explosief gestegen is.

    dow-divisor

    Dow Divisor vanaf 1930

    3. Aandelenkoers versus marktwaarde

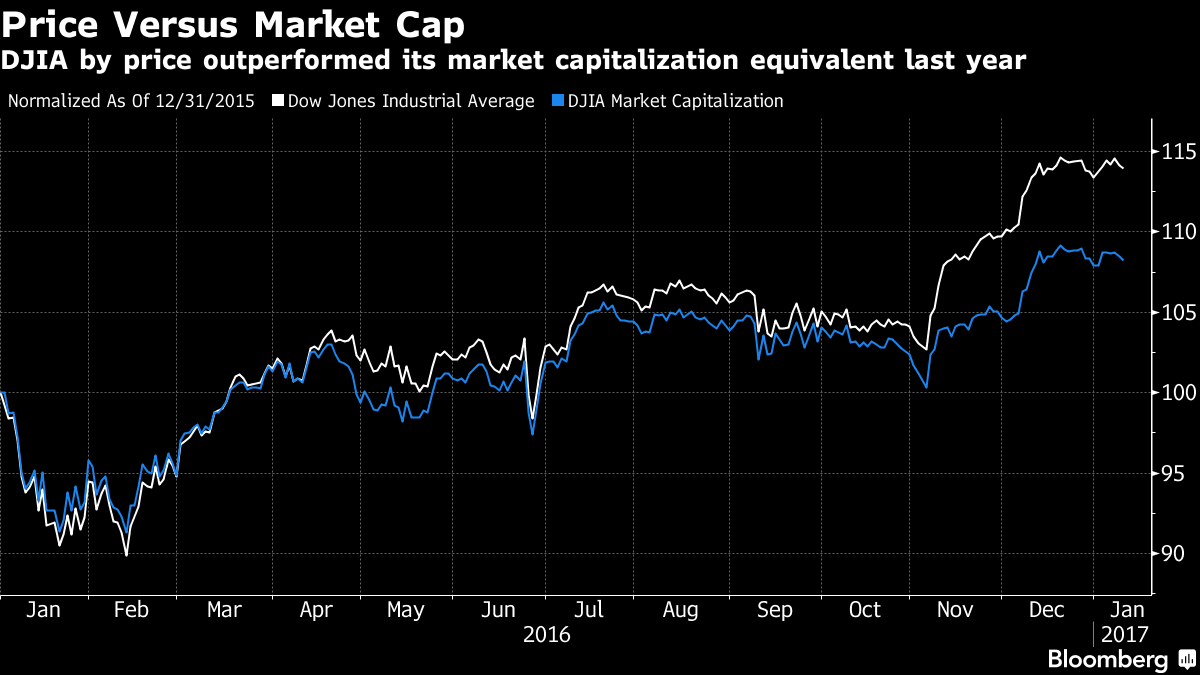
    In tegenstelling tot andere populaire aandelenindices zoals de S&P 500 is de Dow Jones een prijs gewogen index, waarbij geen rekening wordt gehouden met de marktwaarde van een onderneming. Sinds eind 2015 heeft JP Morgan Chase met een waardestijging van 32% slechts 140 punten aan de index toegevoegd, terwijl Goldman Sachs in dezelfde periode met een vergelijkbare waardestijging van 36% maar liefst 437 punten aan de index toevoegde. Hoe kan het dat de waardestijging van het aandeel Goldman Sachs een drie keer zo grote bijdrage levert aan de stijging van de Dow Jones, terwijl de marktwaarde van haar concurrent JP Morgan ruim drie keer zo groot is als die van Goldman Sachs ($312 miljard versus $103 miljard)? Het simpele antwoord op die vraag is dat één aandeel van JP Morgan momenteel $84,63 waard is, terwijl één aandeel van Goldman Sachs $229,32 kost. Een procent stijging van het laatstgenoemde aandeel heeft dus een veel grotere impact op de index. Zou je een weging toepassen op basis van de marktwaarde van alle ondernemingen in de Dow Jones index, dan lag de grens van 20.000 punten waarschijnlijk nog ver voor ons. De volgende grafiek van Bloomberg laat zien dat de stijging van de afgelopen drie maanden voor een aanzienlijk deel toegeschreven kan worden aan deze gebrekkige rekenmethode.

    price-versus-market-cap-dow-jones

    Dow Jones index sterk beïnvloedt door bedrijven met hoge aandelenkoers (Grafiek via Bloomberg)

  • The Dow Jones: Beautiful Tree in the Desert

    The Dow Jones Industrial Average (DJIA) Index is the only stock market index that covers both the second and the third industrial revolution. Calculating share indexes such as the Dow Jones Industrial Average and showing this index in a historical graph is a useful way to show which phase the industrial revolution is in. Changes in the DJIA shares basket, changes in the formula and stock splits during the take-off phase and acceleration phase of industrial revolutions are perfect transition-indicators. The similarities of these indicators during the last two revolutions are fascinating, but also a reason for concern. In fact the graph of the DJIA is a classic example of fictional truth, a fata morgana.

    Transitions

    Every production phase, civilization or other human invention goes through a so called transformation process. Transitions are social transformation processes that cover at least one generation. In this article I will use one such transition to demonstrate the position of our present civilization and its possible effect on stock exchange rates. A transition has the following characteristics:
    • it involves a structural change of civilization or a complex subsystem of our civilization
    • it shows technological, economical, ecological, socio cultural and institutional changes at different levels that influence and enhance each other
    • it is the result of slow changes (changes in supplies) and fast dynamics (flows)
    • A transition process is not fixed from the start because during the transition processes will adapt to the new situation. A transition is not dogmatic.

    Four transition phases

    In general transitions can be seen to go through the S curve and we can distinguish four phases (see fig. 1):
    1. a pre development phase of a dynamic balance in which the present status does not visibly change
    2. a take off phase in which the process of change starts because of changes in the system
    3. an acceleration phase in which visible structural changes take place through an accumulation of socio cultural, economical, ecological and institutional changes influencing each other; in this phase we see collective learning processes, diffusion and processes of embedding
    4. a stabilization phase in which the speed of sociological change slows down and a new dynamic balance is achieved through learning
    A product life cycle also goes through an S curve. In that case there is a fifth phase: The degeneration phase in which cost rises because of over capacity and the producer will finally withdraw from the market. The-Dow-Jones-2

    Figure 1. The S curve of a transition

    Four phases in a transition best visualized by means of an S curve: Pre-development, Take-off, Acceleration, Stabilization. When we look back into the past we see three transitions, also called industrial revolutions, taking place with far-reaching effect :
    1. The first industrial revolution (1780 until circa 1850); the steam engine
    2. The second industrial revolution (1870 until circa 1930); electricity, oil and the car
    3. The third industrial revolution (1950 until ….); computer and microprocessor

    Dow Jones Industrial Average (DJIA)

    The Dow Jones Industrial Average (DJIA) index is the oldest shares index in the United States. A select group of journalists of The Wall Street Journal decide which companies are included in the most influential stock exchange index in the world. Unlike most other indices the Dow is a price average index. This means that shares with a high price have a great influence on the movements of the index. Calculating stock index values such as the Dow and presenting the index in a historical graphs is a perfect way of indicating which phase an industrial revolution is in. The Dow was first published in 1896. The index was calculated by dividing the sum of the shares by 12: Dow-index_1896 = (x1 + x2+ ……….+x12) / 12 An index is calculated on the basis of a set of shares. Every index has its own formula and the formula results in the number of points of the index. However, this set of shares changes regularly. It is therefore very strange that different sets of shares are represented by the same unit. After a period of 25 years the value of the original set of 12 apples is compared to the value of a set of 30 pears. In 1929 only 2 of the original 12 companies of the Dow were still present. The most remarkable characteristic is of course the constantly changing set of shares. Generally speaking, the companies that are removed from the set are in a stabilization or degeneration phase. Companies in a take off phase or acceleration phase are added to the set. This greatly increases the chance that the index will rise rather than go down. This is obvious, especially when this is done during the acceleration phase of a transition. In 1916 the Dow was extended to 20 companies; 4 companies were taken out and 12 were added. Dow-index_1916 = (x1 + x2+ ……….+x20) / 20 This way of calculating the index actually creates a kind of pyramid scheme. All goes well as long as companies are added that are in their take off phase or acceleration phase. At the end of a transition there will be fewer companies in those phases. The shares of a number of companies were split during the years and for those shares a factor was added to the calculation. The formula is as follows (American Can is multiplied by 6, General Electric by 4). Dow-index_1927 = (6.x1 + 4.x2+ ……….+x20) / 20 Things take a bizarre turn with the changes to the Dow Jones of 1 October 1928. On 1 October 1928 the Dow Jones is enlarged to 30 shares. Because all calculations are done by hand, the calculation formula of the index is simplified. The Dow Divisor is introduced. The index is calculated by dividing the sum of the share values using the Dow Divisor. Because the value on 1 October 1928 must remain the same, the Dow Divisor is set at 16.67. The index graphs of before and after 1 October be a continuous line. Dow-index_okt_1928 = (x1 + x2+ ……….+x30) / 16.67 On 1 October 1928 the value of the Dow is 239, so the sum of the shares is 3984 dollars. From that moment on an increase (or decrease) of the set of shares results in almost twice as many (or fewer) index points. In the old formula the sum would have been divided by 30. With every change in the set of shares used to calculate the Dow, the value of the Dow Divisor also changes. This is done because the index which is the result of two different sets of shares at the moment the set is changed must be the same for both sets at that point in time. The same thing happens when shares are split. In the fall of 1928 and spring of 1929 8 shares are split decreasing the Dow Divisor to 10.47. Dow-index_sept_1929 = (x1 + x2+ ……….+x30) / 10.47 From that moment on a an increase (or decrease) of the set of shares results in almost three times as many (or fewer) index points as a year before. In the old formula the sum would have been divided by 30. The Dow’s highest point is on 3 September 1929 at 381 points. So the extreme increase followed by an extreme decrease of the Dow in the period 1920 – 1932 was primarily caused by changes to the formula, the constant changes to the set of shares during the acceleration phase of the second industrial revolution and splitting of s`hares during this period. Because of these changes in the Dow investors were wrong footed. The companies whose shares constituted the Dow index at that time also continued into the stabilization and degeneration phase.

    The Dow Jones Industrial Average: Beautiful Tree in the Desert

    tree-desertIn many graphs the y-axis is a fixed unit, such as kg, meter, liter or euro. In the graphs showing the stock exchange values, this also seems to be the case because the unit shows a number of points. However, this is far from true! An index point is not a fixed unit in time and does not have any historical significance. An index is calculated on the basis of a set of shares. Every index has its own formula and the formula gives the number of points of the index. Unfortunately many people attach a lot of value to these graphs which are, however, very deceptive. An index is calculated on the basis of a set of shares. Every index has its own formula and the formula results in the number of points of the index. However, this set of shares changes regularly. For a new period the value is based on a different set of shares. It is very strange that these different sets of shares are represented as the same unit. In less than ten years twelve of the thirty companies (i.e. 40%) in the Dow Jones were replaced. Over a period of sixteen years, twenty companies were replaced, a figure of 67%. This meant that over a very short period we were left comparing a basket of today’s apples with a basket of yesterday’s pears. Even more disturbing is the fact that with every change in the set of shares used to calculate the number of points, the formula also changes. This is done because the index, which is the result of two different sets of shares at the moment the set is changed, must be the same for both sets at that point in time. The index graphs must be continuous lines. For example, the Dow Jones is calculated by adding the shares and dividing the result by a number. Because of changes in the set of shares and the splitting of shares the divider changes continuously. At the moment the divider is 0.15571590501117 but in 1985 this number was higher than 1. An index point in two periods of time is therefore calculated in different ways: Dow1985 = (x1 + x2 +..+x30) / 1 Dow2014 = (x1 + x2 +.. + x30) / 0.15571590501117 In the 1990s many shares were split. To make sure the result of the calculation remained the same both the number of shares and the divider changed. An increase in share value of 1 dollar of the set of shares in 2014 results is 6.4 times more points than in 1985. The fact that in the 1990s many shares were split is probably the cause of the exponential growth of the Dow Jones index. At the moment the Dow is at 16,437 points. If we used the 1985 formula it would be at 2,559 points. The most remarkable characteristic is of course the constantly changing set of shares. Generally speaking, the companies that are removed from the set are in a stabilization or degeneration phase. Companies in a take off phase or acceleration phase are added to the set. This greatly increases the chance that the index will rise rather than go down. This is obvious, especially when this is done during the acceleration phase of a transition. From 1980 onward 7 ICT companies (3M, AT&T, Cisco, HP, IBM, Intel, Microsoft), the engines of the latest revolution and 5 financial institutions, which always play an important role in every transition, were added to the Dow Jones.

    dowdivisor

    Table 1. Changes in the Dow, stock splits and the value of the Dow Divisor after the market crash of 1929

    Dow Jones Industrial Average

    The-Dow-Jones-historical

    Figure 2 Exchange rates of Dow Jones during the latest two industrial revolutions. During the last few years the rate increases have accelerated enormously

    Double manipulation

    On September 23 2013, the Dow got the biggest facelift since 2004 in one fell swoop with the removal of 3 company constituents: Hewlett-Packard Company (NYSE:HPQ) (+21.5% ytd), Bank of America Corp (NYSE:BAC) (+52.0% ytd) and Alcoa Inc (NYSE:AA) (-1.8% ytd) And the addition of: Goldman Sachs Group Inc (NYSE:GS) (+25 ytd), Nike Inc (NYSE:NKE) (+27% ytd) and Visa Inc (NYSE:V) (+18% ytd) What is even more striking is that the three companies removed from the index have a low share price (HP is trading at an approximate price of $22, BoA at $14 and Alcoa at $8 for a sum total of $44) while the three stocks added have a high market price (Goldman Sachs at $164, Nike at $67 and Visa at $184 for a sum total of $415). Of course there is the Dow Divisor which supposedly ensures that the value of the Dow Jones with the new shares is the same as the value of the Dow Jones with the old shares but this effect is only short-term as, in the long-term, the profits of the higher priced stocks will be greater/stronger than those of the weaker stocks that they replaced. The Dow 30 is calculated by dividing the sum of the 30 constituents’ shares by the Dow Divisor. On September 10, the Dow Jones ended at 15,191 points. The Dow Divisor currently has a value of 0.130216081. This means that the current total of 30 shares is worth $1,978 (15,191 x 0.130216081=$1,978). HP is trading at an approximate price of $22, BoA at $14 and Alcoa at $8 (sum total of $44). These shares will be replaced by Goldman Sachs at $164, Nike at $67 and Visa at $184 (sum total of $415) which is 9.4 times more. This means that the new sum of the 30 stocks have a value of $2,349 (1978 – 44 + 415) and, therefore we expect that the Dow Divisor will be adjusted from 0.130216081 to 0.154631 to get back to the original 15,191 index points (15,191 x 0.154631 = $2,349). Given the above, had the three old shares increased by 10% each in price in the past the Dow 30 would have increased by 33.8 points in total (10% x 44 divided by 0.130216081 = 33.79 points) assuming there was no change in the price of the other 27 stocks. As of September 23rd, however, a corresponding 10% increase in the price of each of the new shares would contribute 268.4 points to the rise of the Dow 30 (10% x 415 divided by 0.154631 = 268.38) or 7.94 times more points. The influence of the 3 losers was: $44 of $1978. This is 2.2% of the Dow Jones Index.?The influence of the 3 winners becomes: $415 of $2,349. This is 17.67% of the Dow Jones Index..? This stinks pretty much of manipulation, even double manipulation!

    Overview from 1997: 20 winners in – 20 losers out, a figure of 67%

    September 23, 2013: Hewlett – Packard Co., Bank of America Inc. and Alcoa Inc. replaced Goldman Sachs Group Inc., Nike Inc. and Visa Inc.?Alcoa has dropped from $40 in 2007 to $8.08. Hewlett- Packard Co. has dropped from $50 in 2010 to $22.36. Bank of America has dropped from $50 in 2007 to $14.48.?But Goldman Sachs Group Inc., Nike Inc. and Visa Inc. have risen 25%, 27% and 18% respectively in 2013.

    September 20, 2012: UnitedHealth Group Inc. (NYSE:UNH) replaces Kraft Foods Group Inc (NASDAQ:KRFT).? Kraft Foods Inc. was split into two companies and was therefore deemed less representative so no longer suitable for the Dow. The share value of UnitedHealth Group Inc. had risen for two years before inclusion in the Dow by 53%.

    June 8, 2009: Cisco Systems, Inc. (NASDAQ:CSCO) and Travelers Companies Inc (NYSE:TRV) replaced Citigroup Inc (NYSE:C) and General Motors Company (NYSE:GM).? Citigroup and General Motors have received billions of dollars of U.S. government money to survive and were not representative of the Do.

    September 22, 2008: Kraft Foods Inc. replaced American International Group Inc (NYSE:AIG). ?American International Group was replaced after the decision of the government to take a 79.9% stake in the insurance giant. AIG was narrowly saved from destruction by an emergency loan from the Fed.

    February 19, 2008: Bank of America Corp. and Chevron Corporation (NYSE:CVX) replaced Altria Group Inc (NYSE:MO) and Honeywell International Inc. (NYSE:HON).? Altria was split into two companies and was deemed no longer suitable for the Dow.? Honeywell was removed from the Dow because the role of industrial companies in the U.S. stock market in the recent years had declined and Honeywell had the smallest sales and profits among the participants in the Dow.

    April 8, 2004: Verizon Communications Inc. (NYSE:VZ), American International Group Inc. and Pfizer Inc. (NYSE:PFE) replace AT&T Inc. (NYSE:T), Eastman Kodak Co. (NYSE:KODK) and International Paper Co (NYSE:IP).? AIG shares had increased over 387% in the previous decade and Pfizer had an increase of more than 675& behind it. Shares of AT & T and Kodak, on the other hand, had decreases of more than 40% in the past decade and were therefore removed from the Dow.

    November 1, 1999: Microsoft Corporation, Intel Corporation (NASDAQ:INTC), SBC Communications and Home Depot Inc (NYSE:HD) replaced Chevron Corporation (NYSE:CVX), Goodyear Tire & Rubber Co (NASDAQ:GT), Union Carbide Corporation and Sears Roebuck.

    March 17, 1997: Travelers Group, Hewlett-Packard Company, Johnson & Johnson and Wal-Mart Stores Incorporated replaced Westinghouse Electric Corporation, Texaco Incorporated, Bethlehem Steel Corporation and Woolworth Corporation.

    Real truth and fictional truth

    Is the number of points that the Dow Jones now gives us a truth or a fictional truth? ?If a fictional truth then the number of points now says absolutely nothing about the state that the economy or society is in when compared to the past. In that case a better guide would be to look at the number of people in society that use food stamps today – That is the real truth A fata morgana is an optical phenomenon, and so is the graph of the The Dow Jones Industrial Average. Mr. Grommen was a teacher in mathematics and physics for eight years at secondary schools. The last twenty years he trained programmers in Oracle-software. The last years he studied transitions, social transformation processes, the S-curve and transitions in relation to market indices. Articles about these topics have been published in various magazines / sites in The Netherlands and Belgium. Article written by Wim Grommen

  • Open brief aan het IMF, de ECB en de EU

    Wim Grommen heeft een open brief gestuurd naar het IMF, de ECB en de Europese Unie. In deze brief roept hij op tot een stimuleringsprogramma dat direct meer geld in de handen van de consument brengt. Is de oplossing echt zo simpel als Wim Grommen formuleert? Hieronder leest u de vertaling van de brief die in het Engels verstuurd werd naar Draghi, van Rompuy en LaGarde….

    Geachte mevrouw Lagarde, geachte heer Draghi en geachte heer Van Rompuy,

    Nu het welzijn van veel burgers in Griekenland, Portugal, Spanje, Italië en Frankrijk onder het kritisch punt dreigt te zakken is het belangrijk dat er op korte termijn een oplossing komt voor deze burgers. De historie heeft namelijk geleerd, dat het omvallen van de pijler welzijn in een samenleving altijd resulteert in revolutie. Via de media hebben mij signalen bereikt, dat revolutie in deze landen ook nu weer aan de poort staat te rammelen. Regeringen van deze landen, ongeacht hun politieke signatuur, zien dit met lede ogen aan, maar staan met de rug tegen de muur.

    Ik stel daarom voor, dat vóór 1 januari 2015, het “8-stappenplan redding Euro” (zie bijlage) dat ik voor database administrators van banken in deze landen heb opgesteld, wordt uitgevoerd. Na het uitvoeren van dit stappenplan zullen de burgers in deze landen voldoende financiële middelen hebben om in 2015 op een menswaardige wijze te kunnen leven. Uw organisaties kunnen zich op deze wijze profileren als Robin Hood. Een Robin Hood, die echter ook zorg draagt voor de welgestelde burger in de samenleving. Het stappenplan voorkomt namelijk ook dat er chaos op de financiële markten ontstaat als gevolg van revoluties. De beurskrach in 1929 heeft laten zien welke desastreuze gevolgen dit kan hebben voor samenlevingen. Voor meer achtergrondinformatie verwijs ik u naar het paper "Current problems associated with the end of the third industrial revolution" dat op een internationaal symposium in Valencia is gepresenteerd in Valencia, The Economic Crisis: Time for a paradigm shift, Towards a systems approach. Tevens verzoek ik u mijn voorstel, om alle Europese beurzen in overleg met de beurseigenaren te herindexeren op 100 punten, te bestuderen. Voor meer achtergrondinformatie voor dit voorstel, verwijs ik u naar mijn artikelen The Dow Jones Industrial Average: a Fata Morgana en Will Obama manipulate the Dow Divisor? From fiction to reality Ik zie uw uitnodiging voor een gesprek over het onderwerp “8-stappenplan redding Euro” of het onderwerp “herindexering Europese beurzen” graag tegemoet. Met vriendelijke groet, Wim Grommen Bijlage

    8-Stappenplan redding Euro

    Database administrators van Europese banken kunnen een bijdrage leveren aan het oplossen van de eurocrisis. De volgende 8 stappen moeten zij op 31 december 2014 uitvoeren, om burgers in hun land die onder het bestaansminimum leven, weer in 2015 een menswaardig bestaan te geven.

    Stap 1: Log in als tabeleigenaar van de tabel “lopende_rekening_burgers” op de productiedatabase

    Stap 2: Disable alle triggers op de tabel “lopende_rekening_burgers”

    Stap 3: Disable alle check-constraints op de tabel “lopende_rekening_burgers”

    Stap 4: Voer het volgende update-statement uit op de tabel “lopende_rekening_burgers”:

    update lopende_rekening_burgers set saldo = saldo + ecb_gift_aan_burger where sofinummer in ( select sofinummer from burgers_belastingdienst where jaarinkomen < norm_jaarinkomen )

    Er zal de komende 2 maanden overleg gevoerd worden tussen het IMF, ECB, EU en de regeringsleiders over de waarden van de variabelen ecb_gift_aan_burger en norm_jaarinkomen. De waarden van deze variabelen kunnen per land worden vastgesteld.

    Stap 5: Maak deze wijziging definitief middels een commit

    Stap 6: Enable weer alle check-constraints op de tabel “lopende_rekening_particulieren”

    Stap 7: Enable weer alle triggers op de tabel “lopende_rekening_particulieren”

    Stap 8: Log weer uit de productiedatabase

    Mocht er geen goedkeuring komen voor dit stappenplan, dan kunnen database administrators hun eigen morele verantwoordelijkheid nemen. Afhankelijk van hun Robin Hood-gevoel bepalen ze dan zelf, wie van hun landgenoten in aanmerking komen voor een gift en tevens hoe hoog deze zal zijn.

    OLYMPUS DIGITAL CAMERA

    Open brief aan de ECB, het IMF en de Europese Unie

  • The Dow Jones Industrial Average: A Fata Morgana

    The Dow Jones Industrial Average (DJIA) Index is the only stock market index that covers both the second and the third industrial revolution. Calculating share indexes such as the Dow Jones Industrial Average and showing this index in a historical graph is a useful way to show which phase the industrial revolution is in. Changes in the DJIA shares basket, changes in the formula and stock splits during the take-off phase and acceleration phase of industrial revolutions are perfect transition-indicators. The similarities of these indicators during the last two revolutions are fascinating, but also a reason for concern. In fact the graph of the DJIA is a classic example of fictional truth, a fata morgana.

    Transitions

    Every production phase, civilization or other human invention goes through a so called transformation process. Transitions are social transformation processes that cover at least one generation. In this article I will use one such transition to demonstrate the position of our present civilization and its possible effect on stock exchange rates. A transition has the following characteristics:
    • It involves a structural change of civilization or a complex subsystem of our civilization
    • It shows technological, economical, ecological, socio cultural and institutional changes at different levels that influence and enhance each other
    • It is the result of slow changes (changes in supplies) and fast dynamics (flows)
    A transition process is not fixed from the start because during the transition processes will adapt to the new situation. A transition is not dogmatic.

    Four transition phases

    In general transitions can be seen to go through the S curve and we can distinguish four phases (see fig. 1):
    1. A pre development phase of a dynamic balance in which the present status does not visibly change
    2. A take off phase in which the process of change starts because of changes in the system
    3. An acceleration phase in which visible structural changes take place through an accumulation of socio cultural, economical, ecological and institutional changes influencing each other; in this phase we see collective learning processes, diffusion and processes of embedding
    4. A stabilization phase in which the speed of sociological change slows down and a new dynamic balance is achieved through learning
    A product life cycle also goes through an S curve. In that case there is a fifth phase:

    5. the degeneration phase in which cost rises because of over capacity and the producer will finally withdraw from the market.

    s-curve

    Figure 1. The S curve of a transition

    Four phases in a transition best visualized by means of an S curve: Pre-development, Take-off, Acceleration, Stabilization. When we look back into the past we see three transitions, also called industrial revolutions, taking place with far-reaching effect :
    1. The first industrial revolution (1780 until circa 1850); the steam engine
    2. The second industrial revolution (1870 until circa 1930); electricity, oil and the car
    3. The third industrial revolution (1950 until ....); computer and microprocessor

    Dow Jones Industrial Average (DJIA)

    The Dow Jones Industrial Average (DJIA) index is the oldest shares index in the United States. A select group of journalists of The Wall Street Journal decide which companies are included in the most influential stock exchange index in the world. Unlike most other indices the Dow is a price average index. This means that shares with a high price have a great influence on the movements of the index. Calculating stock index values such as the Dow and presenting the index in a historical graphs is a perfect way of indicating which phase an industrial revolution is in. The Dow was first published in 1896. The index was calculated by dividing the sum of the shares by 12: Dow-index_1896 = (x1 + x2+ ..........+x12) / 12 An index is calculated on the basis of a set of shares. Every index has its own formula and the formula results in the number of points of the index. However, this set of shares changes regularly. It is therefore very strange that different sets of shares are represented by the same unit. After a period of 25 years the value of the original set of 12 apples is compared to the value of a set of 30 pears. In 1929 only 2 of the original 12 companies of the Dow were still present. The most remarkable characteristic is of course the constantly changing set of shares. Generally speaking, the companies that are removed from the set are in a stabilization or degeneration phase. Companies in a take off phase or acceleration phase are added to the set. This greatly increases the chance that the index will rise rather than go down. This is obvious, especially when this is done during the acceleration phase of a transition. In 1916 the Dow was extended to 20 companies; 4 companies were taken out and 12 were added. Dow-index_1916 = (x1 + x2+ ..........+x20) / 20 This way of calculating the index actually creates a kind of pyramid scheme. All goes well as long as companies are added that are in their take off phase or acceleration phase. At the end of a transition there will be fewer companies in those phases. The shares of a number of companies were split during the years and for those shares a factor was added to the calculation. The formula is as follows (American Can is multiplied by 6, General Electric by 4). Dow-index_1927 = (6.x1 + 4.x2+ ..........+x20) / 20 Things take a bizarre turn with the changes to the Dow Jones of 1 October 1928. On 1 October 1928 the Dow Jones is enlarged to 30 shares. Because all calculations are done by hand, the calculation formula of the index is simplified. The Dow Divisor is introduced. The index is calculated by dividing the sum of the share values using the Dow Divisor. Because the value on 1 October 1928 must remain the same, the Dow Divisor is set at 16.67. The index graphs of before and after 1 October be a continuous line. Dow-index_okt_1928 = (x1 + x2+ ..........+x30) / 16.67 On 1 October 1928 the value of the Dow is 239, so the sum of the shares is 3984 dollars. From that moment on an increase (or decrease) of the set of shares results in almost twice as many (or fewer) index points. In the old formula the sum would have been divided by 30. With every change in the set of shares used to calculate the Dow, the value of the Dow Divisor also changes. This is done because the index which is the result of two different sets of shares at the moment the set is changed must be the same for both sets at that point in time. The same thing happens when shares are split. In the fall of 1928 and spring of 1929 8 shares are split decreasing the Dow Divisor to 10.47. Dow-index_sept_1929 = (x1 + x2+ ..........+x30) / 10.47 From that moment on a an increase (or decrease) of the set of shares results in almost three times as many (or fewer) index points as a year before. In the old formula the sum would have been divided by 30. The Dow’s highest point is on 3 September 1929 at 381 points. So the extreme increase followed by an extreme decrease of the Dow in the period 1920 – 1932 was primarily caused by changes to the formula, the constant changes to the set of shares during the acceleration phase of the second industrial revolution and splitting of s`hares during this period. Because of these changes in the Dow investors were wrong footed. The companies whose shares constituted the Dow index at that time also continued into the stabilization and degeneration phase.

    The Dow Jones Industrial Index: a fata morgana

    In many graphs the y-axis is a fixed unit, such as kg, meter, liter or euro. In the graphs showing the stock exchange values, this also seems to be the case because the unit shows a number of points. However, this is far from true! An index point is not a fixed unit in time and does not have any historical significance. An index is calculated on the basis of a set of shares. Every index has its own formula and the formula gives the number of points of the index. Unfortunately many people attach a lot of value to these graphs which are, however, very deceptive. An index is calculated on the basis of a set of shares. Every index has its own formula and the formula results in the number of points of the index. However, this set of shares changes regularly. For a new period the value is based on a different set of shares. It is very strange that these different sets of shares are represented as the same unit. In less than ten years twelve of the thirty companies (i.e. 40%) in the Dow Jones were replaced. Over a period of sixteen years, twenty companies were replaced, a figure of 67%. This meant that over a very short period we were left comparing a basket of today’s apples with a basket of yesterday’s pears. Even more disturbing is the fact that with every change in the set of shares used to calculate the number of points, the formula also changes. This is done because the index, which is the result of two different sets of shares at the moment the set is changed, must be the same for both sets at that point in time. The index graphs must be continuous lines. For example, the Dow Jones is calculated by adding the shares and dividing the result by a number. Because of changes in the set of shares and the splitting of shares the divider changes continuously. At the moment the divider is 0.15571590501117 but in 1985 this number was higher than 1. An index point in two periods of time is therefore calculated in different ways: Dow1985 = (x1 + x2 +..+x30) / 1 Dow2014 = (x1 + x2 +.. + x30) / 0.15571590501117 In the 1990s many shares were split. To make sure the result of the calculation remained the same both the number of shares and the divider changed. An increase in share value of 1 dollar of the set of shares in 2014 results is 6.4 times more points than in 1985. The fact that in the 1990s many shares were split is probably the cause of the exponential growth of the Dow Jones index. At the moment the Dow is at 16,437 points. If we used the 1985 formula it would be at 2,559 points. The most remarkable characteristic is of course the constantly changing set of shares. Generally speaking, the companies that are removed from the set are in a stabilization or degeneration phase. Companies in a take off phase or acceleration phase are added to the set. This greatly increases the chance that the index will rise rather than go down. This is obvious, especially when this is done during the acceleration phase of a transition. From 1980 onward 7 ICT companies (3M, AT&T, Cisco, HP, IBM, Intel, Microsoft), the engines of the latest revolution and 5 financial institutions, which always play an important role in every transition, were added to the Dow Jones.

    dowdivisor-table

    Table 1. Changes in the Dow, stock splits and the value of the Dow Divisor after the market crash of 1929

    Dow Jones Industrial Average

    Exchange rates of Dow Jones during the latest two industrial revolutions

    Figure 2 Exchange rates of Dow Jones during the latest two industrial revolutions. During the last few years the rate increases have accelerated enormously.

    Double manipulation

    On September 23 2013, the Dow got the biggest facelift since 2004 in one fell swoop with the removal of 3 company constituents: Hewlett- Packard Co. (+21.5% ytd), Bank of America Inc. (+52.0% ytd) and Alcoa Inc. (-1.8% ytd) And the addition of: Goldman Sachs Group Inc. (+25 ytd), Nike Inc. (+27% ytd) and Visa Inc. (+18% ytd) What is even more striking is that the three companies removed from the index have a low share price (HP is trading at an approximate price of $22, BoA at $14 and Alcoa at $8 for a sum total of $44) while the three stocks added have a high market price (Goldman Sachs at $164, Nike at $67 and Visa at $184 for a sum total of $415). Of course there is the Dow Divisor which supposedly ensures that the value of the Dow Jones with the new shares is the same as the value of the Dow Jones with the old shares but this effect is only short-term as, in the long-term, the profits of the higher priced stocks will be greater/stronger than those of the weaker stocks that they replaced. The Dow 30 is calculated by dividing the sum of the 30 constituents’ shares by the Dow Divisor. On September 10, the Dow Jones ended at 15,191 points. The Dow Divisor currently has a value of 0.130216081. This means that the current total of 30 shares is worth $1,978 (15,191 x 0.130216081=$1,978). HP is trading at an approximate price of $22, BoA at $14 and Alcoa at $8 (sum total of $44). These shares will be replaced by Goldman Sachs at $164, Nike at $67 and Visa at $184 (sum total of $415) which is 9.4 times more. This means that the new sum of the 30 stocks have a value of $2,349 (1978 – 44 + 415) and, therefore we expect that the Dow Divisor will be adjusted from 0.130216081 to 0.154631 to get back to the original 15,191 index points (15,191 x 0.154631 = $2,349). Given the above, had the three old shares increased by 10% each in price in the past the Dow 30 would have increased by 33.8 points in total (10% x 44 divided by 0.130216081 = 33.79 points) assuming there was no change in the price of the other 27 stocks. As of September 23rd, however, a corresponding 10% increase in the price of each of the new shares would contribute 268.4 points to the rise of the Dow 30 (10% x 415 divided by 0.154631 = 268.38) or 7.94 times more points. The influence of the 3 losers was: $44 of $1978. This is 2.2% of the Dow Jones Index.
The influence of the 3 winners becomes: $415 of $2,349. This is 17.67% of the Dow Jones Index.
This stinks pretty much of manipulation, even double manipulation! Overview from 1997 : 20 winners in – 20 losers out, a figure of 67%

    September 23, 2013: Hewlett – Packard Co., Bank of America Inc. and Alcoa Inc. replaced Goldman Sachs Group Inc., Nike Inc. and Visa Inc.
Alcoa has dropped from $40 in 2007 to $8.08. Hewlett- Packard Co. has dropped from $50 in 2010 to $22.36. Bank of America has dropped from $50 in 2007 to $14.48.
But Goldman Sachs Group Inc., Nike Inc. and Visa Inc. have risen 25%, 27% and 18% respectively in 2013.

    September 20, 2012: UnitedHealth Group Inc. (UNH) replaces Kraft Foods Inc.
Kraft Foods Inc. was split into two companies and was therefore deemed less representative so no longer suitable for the Dow. The share value of UnitedHealth Group Inc. had risen for two years before inclusion in the Dow by 53%.

    June 8, 2009: Cisco and Travelers replaced Citigroup and General Motors.
 Citigroup and General Motors have received billions of dollars of U.S. government money to survive and were not representative of the Do.

    September 22, 2008: Kraft Foods Inc. replaced American International Group. 
American International Group was replaced after the decision of the government to take a 79.9% stake in the insurance giant. AIG was narrowly saved from destruction by an emergency loan from the Fed.

    February 19, 2008: Bank of America Corp. and Chevron Corp. replaced Altria Group Inc. and Honeywell International.
Altria was split into two companies and was deemed no longer suitable for the Dow.
 Honeywell was removed from the Dow because the role of industrial companies in the U.S. stock market in the recent years had declined and Honeywell had the smallest sales and profits among the participants in the Dow.

    April 8, 2004: Verizon Communications Inc., American International Group Inc. and Pfizer Inc. replace AT & T Corp., Eastman Kodak Co. and International Paper.
AIG shares had increased over 387% in the previous decade and Pfizer had an increase of more than 675& behind it. Shares of AT & T and Kodak, on the other hand, had decreases of more than 40% in the past decade and were therefore removed from the Dow.

    November 1, 1999: Microsoft Corporation, Intel Corporation, SBC Communications and Home Depot Incorporated replaced Chevron Corporation, Goodyear Tire & Rubber Company, Union Carbide Corporation and Sears Roebuck.

    March 17, 1997: Travelers Group, Hewlett-Packard Company, Johnson & Johnson and Wal-Mart Stores Incorporated replaced Westinghouse Electric Corporation, Texaco Incorporated, Bethlehem Steel Corporation and Woolworth Corporation.

    Real truth and fictional truth

    Is the number of points that the Dow Jones now gives us a truth or a fictional truth? 
If a fictional truth then the number of points now says absolutely nothing about the state that the economy or society is in when compared to the past. In that case a better guide would be to look at the number of people in society that use food stamps today – That is the real truth

    De magie van de aandelenmarkt

    Anthony Freda

    Mr. Grommen was a teacher in mathematics and physics for eight years at secondary schools. The last twenty years he trained programmers in Oracle-software. The last years he studied transitions, social transformation processes, the S-curve and transitions in relation to market indices. Articles about these topics have been published in various magazines / sites in The Netherlands and Belgium.

  • The Dow Jones Index Is A Hoax

    The Dow Jones Industrial Average (DJIA) Index is the only stock market index that covers both the second and the third industrial revolution.

    Calculating share indexes such as the Dow Jones Industrial Average and showing this index in a historical graph is a useful way to show which phase the industrial revolution is in. Changes in the DJIA shares basket, changes in the formula and stock splits during the take-off phase and acceleration phase of industrial revolutions are perfect transition-indicators. The similarities of these indicators during the last two revolutions are fascinating, but also a reason for concern. In fact the graph of the DJIA is a classic example of fictional truth, a hoax.
    Transitions

    Every production phase, civilization or other human invention goes through a so called transformation process. Transitions are social transformation processes that cover at least one generation. In this article I will use one such transition to demonstrate the position of our present civilization and its possible effect on stock exchange rates.

    A transition has the following characteristics:

    • it involves a structural change of civilization or a complex subsystem of our civilization
    • it shows technological, economical, ecological, socio-cultural and institutional changes at different levels that influence and enhance each other
    • t is the result of slow changes (changes in supplies) and fast dynamics (flows)
    A transition process is not fixed from the start because during the transition processes will adapt to the new situation. A transition is not dogmatic.

    Four transition phases

    In general transitions can be seen to go through the S curve and we can distinguish four phases (see fig. 1 below):
    1. A pre-development phase of a dynamic balance in which the present status does not visibly change
    2. A take off phase in which the process of change starts because of changes in the system
    3. An acceleration phase in which visible structural changes take place through an accumulation of socio cultural, economical, ecological and institutional changes influencing each other; in this phase we see collective learning processes, diffusion and processes of embedding
    4. A stabilization phase in which the speed of sociological change slows down and a new dynamic balance is achieved through learning
    A product life cycle also goes through an S curve. In that case there is a fifth phase: 5. The degeneration phase in which cost rises because of over capacity and the producer will finally withdraw from the market.

    The S curve of a transition

    Figure 1. The S curve of a transition

    
Four phases in a transition best visualized by means of an S curve:
    • Pre-development
    • Take-off
    • Acceleration
    • Stabilization
    When we look back into the past we see three transitions, also called industrial revolutions, taking place with far-reaching effect:
    1. The first industrial revolution (1780 until circa 1850); the steam engine
    2. The second industrial revolution (1870 until circa 1930); electricity, oil and the car
    3. The third industrial revolution (1950 until ….); computer and microprocessor

    Dow Jones Industrial Average (DJIA)

    The Dow Index was first published in 1896 when it consisted of just 12 constituents and was a simple price average index in which the sum total value of the shares of the 12 constituents were simply divided by 12. As such those shares with the highest prices had the greatest influence on the movements of the index as a whole. In 1916 the Dow 12 became the Dow 20 with four companies being removed from the original twelve and twelve new companies being added. In October, 1928 the Dow 20 became the Dow 30 but the calculation of the index was changed to be the sum of the value of the shares of the 30 constituents divided by what is known as the Dow Divisor. While the inclusion of the Dow Divisor may have seemed totally straightforward it was – and still is – anything but! Why so? Because every time the number of, or specific constituent, companies change in the index any comparison of the new index value with the old index value is impossible to make with any validity whatsoever. It is like comparing the taste of a cocktail of fruits when the number of different fruits and their distinctive flavours – keep changing. Let me explain the aforementioned as it relates to the Dow.

    The False Appreciation of the Dow Explained

    On the other hand, companies in the take-off or acceleration phase are added to the index. This greatly increases the chances that the index will always continue to advance rather than decline. In fact, the manner in which the Dow index is maintained actually creates a kind of pyramid scheme! All goes well as long as companies are added that are in their take-off or acceleration phase in place of companies in their stabilization or degeneration phase. On October 1st, 1928, when the Dow was enlarged to 30 constituents, the calculation formula for the index was changed to take into account the fact that the shares of companies in the Index split on occasion. It was determined that, to allow the value of the Index to remain constant, the sum total of the share values of the 30 constituent companies would be divided by 16.67 ( called the Dow Divisor) as opposed to the previous 30. On October 1st, 1928 the sum value of the shares of the 30 constituents of the Dow 30 was $3,984 which was then divided by 16.67 rather than 30 thereby generating an index value of 239 (3984 divided by 16.67) instead of 132.8 (3984 divided by 30) representing an increase of 80% overnight!! This action had the affect of putting dramatically more importance on the absolute dollar changes of those shares with the greatest price changes. But it didn’t stop there! On September, 1929 the Dow divisor was adjusted yet again. This time it was reduced even further down to 10.47 as a way of better accounting for the change in the deletion and addition of constituents back in October, 1928 which, in effect, increased the October 1st, 1928 index value to 380.5 from the original 132.8 for a paper increase of 186.5%!!! From September, 1929 onwards (at least for a while) this “adjustment” had the affect – and I repeat myself – of putting even that much more importance on the absolute dollar changes of those shares with the greatest changes.

    How the Dow Divisor Contributed to the Crash of ‘29

    From the above analyses/explanation it is evident that the dramatic “adjustments” to the Dow Divisor (coupled with the addition/deletion of constituent companies according to which transition phase they were in) were major contributors to the dramatic increase in the Dow from 1920 until October 1929 and the following dramatic decrease in the Dow 30 from then until 1932 notwithstanding the economic conditions of the time as well.

    Dow Jones Industrial Index is a Hoax

    In many graphs the y-axis is a fixed unit, such as kg, meter, liter or euro. In the graphs showing the stock exchange values, this also seems to be the case because the unit shows a number of points. However, this is far from true! An index point is not a fixed unit in time and does not have any historical significance. An index is calculated on the basis of a set of shares. Every index has its own formula and the formula gives the number of points of the index. Unfortunately many people attach a lot of value to these graphs which are, however, very deceptive. An index is calculated on the basis of a set of shares. Every index has its own formula and the formula results in the number of points of the index. However, this set of shares changes regularly. For a new period the value is based on a different set of shares. It is very strange that these different sets of shares are represented as the same unit. In less than ten years twelve of the thirty companies (i.e. 40%) in the Dow Jones were replaced. Over a period of sixteen years, twenty companies were replaced, a figure of 67%. This meant that over a very short period we were left comparing a basket of today’s apples with a basket of yesterday’s pears. Even more disturbing is the fact that with every change in the set of shares used to calculate the number of points, the formula also changes. This is done because the index, which is the result of two different sets of shares at the moment the set is changed, must be the same for both sets at that point in time. The index graphs must be continuous lines. For example, the Dow Jones is calculated by adding the shares and dividing the result by a number. Because of changes in the set of shares and the splitting of shares the divider changes continuously. At the moment the divider is 0.15571590501117 but in 1985 this number was higher than 1. An index point in two periods of time is therefore calculated in different ways:

    Dow1985 = (x1 + x2 +..+x30) / 1

    Dow2014 = (x1 + x2 +.. + x30) / 0.15571590501117

    In the 1990s many shares were split. To make sure the result of the calculation remained the same both the number of shares and the divider changed. An increase in share value of 1 dollar of the set of shares in 2014 results is 6.4 times more points than in 1985. The fact that in the 1990s many shares were split is probably the cause of the exponential growth of the Dow Jones index. At the moment the Dow is at 16,437 points. If we used the 1985 formula it would be at 2,559 points. The most remarkable characteristic is of course the constantly changing set of shares. Generally speaking, the companies that are removed from the set are in a stabilization or degeneration phase. Companies in a take off phase or acceleration phase are added to the set. This greatly increases the chance that the index will rise rather than go down. This is obvious, especially when this is done during the acceleration phase of a transition. From 1980 onward 7 ICT companies (3M, AT&T, Cisco, HP, IBM, Intel, Microsoft), the engines of the latest revolution and 5 financial institutions, which always play an important role in every transition, were added to the Dow Jones. Dow Changes Since 1929:

    Changes in the Dow, stock splits and the value of the Dow Divisor after the market crash of 1929

    Table 1. Changes in the Dow, stock splits and the value of the Dow Divisor after the market crash of 1929

    Dow Jones Industrial Average:

    Exchange rates of Dow Jones during the latest two industrial revolutions Figure 2. Exchange rates of Dow Jones during the latest two industrial revolutions. During the last few years the rate increases have accelerated enormously

    Overview from 1997 : 20 winners in – 20 losers out, a figure of 67%

    September 23, 2013: Hewlett – Packard Co., Bank of America Inc. and Alcoa Inc. will replaced by Goldman Sachs Group Inc., Nike Inc. and Visa Inc.
Alcoa has dropped from $40 in 2007 to $8.08. Hewlett- Packard Co. has dropped from $50 in 2010 to $22.36.
Bank of America has dropped from $50 in 2007 to $14.48.
But Goldman Sachs Group Inc., Nike Inc. and Visa Inc. have risen 25%, 27% and 18% respectively in 2013. September 20, 2012: UnitedHealth Group Inc. (UNH) replaces Kraft Foods Inc.
Kraft Foods Inc. was split into two companies and was therefore deemed less representative so no longer suitable for the Dow. The share value of UnitedHealth Group Inc. had risen for two years before inclusion in the Dow by 53%. June 8, 2009: Cisco and Travelers replaced Citigroup and General Motors.
 Citigroup and General Motors have received billions of dollars of U.S. government money to survive and were not representative of the Do. September 22, 2008: Kraft Foods Inc. replaced American International Group. 
American International Group was replaced after the decision of the government to take a 79.9% stake in the insurance giant. AIG was narrowly saved from destruction by an emergency loan from the Fed. February 19, 2008: Bank of America Corp. and Chevron Corp. replaced Altria Group Inc. and Honeywell International.
Altria was split into two companies and was deemed no longer suitable for the Dow.
 Honeywell was removed from the Dow because the role of industrial companies in the U.S. stock market in the recent years had declined and Honeywell had the smallest sales and profits among the participants in the Dow. April 8, 2004: Verizon Communications Inc., American International Group Inc. and Pfizer Inc. replace AT & T Corp., Eastman Kodak Co. and International Paper.
AIG shares had increased over 387% in the previous decade and Pfizer had an increase of more than 675& behind it. Shares of AT & T and Kodak, on the other hand, had decreases of more than 40% in the past decade and were therefore removed from the Dow. November 1, 1999: Microsoft Corporation, Intel Corporation, SBC Communications and Home Depot Incorporated replaced Chevron Corporation, Goodyear Tire & Rubber Company, Union Carbide Corporation and Sears Roebuck. March 17, 1997: Travelers Group, Hewlett-Packard Company, Johnson & Johnson and Wal-Mart Stores Incorporated replaced Westinghouse Electric Corporation, Texaco Incorporated, Bethlehem Steel Corporation and Woolworth Corporation. Real truth and fictional truth Is the number of points that the Dow Jones now gives us a truth or a fictional truth? 
If a fictional truth then the number of points now says absolutely nothing about the state that the economy or society is in when compared to the past. In that case a better guide would be to look at the number of people in society that use food stamps today – That is the real truth!

  • De beursindex is een fata morgana

    Heeft u zich wel eens afgevraagd welke informatie een beursindex nu eigenlijk geeft? Een index-punt is geen vaste eenheid in de tijd en u mag er dan ook, historisch gezien, geen enkele betekenis aan hechten. In feite is elke beursindex een fata morgana.

    Twee metingen tijdens een marathon

    Stelt u zich eens de volgende twee metingen voor:

    • In de eerste meting wordt de gemiddelde tijd gemeten die 30 hardlopers nodig hebben voor het lopen van een marathon.
    • In de tweede meting starten dezelfde lopers een marathon. Na 10 kilometer worden echter de 10 langzaamste lopers vervangen door 10 frisse. Na 20 kilometer worden weer de 10 langzaamste lopers door 10 frisse vervangen en na 30 kilometer gebeurt dit nogmaals. Ook in deze tweede meting wordt de gemiddelde tijd bepaald.

    Bij welke meting zal het gemiddelde tijd over de 30 lopers het snelst zijn?

    En wat zal er met de gemiddelde tijd gebeuren, als de stopwatch tijdens de tweede meting steeds langzamer gaat lopen? In het begin van de tweede meting gaan er 60 seconden in een minuut en op het einde van deze meting loopt dit op tot 380 seconden.

    Heeft het dan nog wel zin om de beide metingen met elkaar te vergelijken?

    Als u deze laatste vraag met nee beantwoordt, dan zult u er waarschijnlijk geen moeite mee hebben, beursindexen zoals de Dow Jones voortaan als fata morgana’s te betitelen.

    Beursindex is een fata morgana

    De parallel met beursindices is eenvoudig te trekken. Een beursindex wordt namelijk berekend aan de hand van een mandje aandelen. Bij elke index gebeurt dat volgens een bepaalde formule en als uitkomst krijg je dan een aantal punten. Dat mandje van aandelen wordt bij elke index echter regelmatig veranderd. Voor de nieuwe periode wordt dus de waarde van een ander mandje aandelen gemeten. Het is natuurlijk vreemd dat je de verschillende mandjes door de tijd heen als zelfde eenheid projecteert.

    In minder dan 10 jaar tijd zijn 12 van de 30 bedrijven, dus 40%, van de bedrijven in de Dow Jones vervangen. Over een periode van 16 jaar werden 20 bedrijven vervangen, dus 67%. Na 16 jaar wordt dus de waarde van een mandje appels vergeleken met de waarde van een mandje peren.

    Het wordt nog vreemder als bij elke overgang van mandjes ook nog eens de formule waarmee de index wordt berekend, verandert. Dit gebeurt omdat de index, de uitkomst van de twee formules van beide mandjes, op het moment van verandering, dezelfde uitkomst moet opleveren. De index-grafiek van de twee tijdsperioden moet per slot van rekening wel op elkaar aansluiten. Bij de Dow Jones bijvoorbeeld, worden alle koersen van de dertig Dow-aandelen bij elkaar opgeteld en vervolgens door een getal gedeeld. Door wijzigingen in het mandje wordt de deler , ook wel Dow Divisor genoemd, telkens veranderd. De deler bedraagt momenteel 0,15571590501117, maar in 1985 was de deler nog méér dan 1. Een indexpunt in de ene periode wordt dus op een hele andere manier berekend dan in een andere periode.

    Dow1985 = (a1 + a2 + ........+a30) / 1 Dow2014 = (b1 + b2 + ........ + b30) / 0.15571590501117

    Aandelensplitsingen

    In de jaren 90 van de vorige eeuw zijn er veel aandelensplitsingen geweest. Om de breuk gelijk te houden is zowel de teller als de noemer van de breuk veranderd. Een koersstijging van 1 dollar van het mandje in 2014 levert dus de facto 6.4 indexpunten meer op dan in 1985. Dat er in de jaren 90 nogal wat aandelensplitsingen zijn geweest, verklaart waarom de Dow Jones in deze periode bijna exponentieel is gestegen. Momenteel staat de Dow op 16.437. Bij het hanteren van de formule uit 1985 zou de index nu op 2.559 staan. Het meest vreemde is natuurlijk de steeds wijzigende samenstelling van het mandje. Over het algemeen is het zo, dat bij het wijzigen van het mandje, de zwak presterende bedrijven uit het mandje gehaald worden. Bedrijven die in de groeifase zitten en goed presteren worden toegevoegd. De kans dat de index na de wijziging van het mandje en de formule stijgt, is dan natuurlijk vele malen groter dan dat de index gaat dalen. Daar hoef je geen kansberekening op los te laten.

    Moet de EU de beurzen laten her-indexeren?

    Het heeft geen enkele zin om het aantal punten van een beursindex te vergelijken met het aantal punten van 30 jaar geleden. De tijd is dan ook rijp dat de EU, na de invoering van de euro, de Europese beurzen laat herindexeren naar 100 punten. Een fata morgana of luchtspiegeling is een optisch fenomeen, zo ook de grafiek van een beursindex.

    aandelen-fata-morgana

    De beursindex is een fata morgana

    Publicaties

    Wim Grommen publiceerde de volgende artikelen op Marketupdate.

    Over Wim Grommen:

    Wim Grommen was o.a. 6 jaar wiskunde/natuurlunde docent op het Norbertuscollege in Roosendaal. Gedurende 25 jaar gaf hij trainingen op het gebied van automatisering; Scheidegger in Venlo, BTA Bergen op Zoom en Oracle Nederland. Voor Oracle heeft hij o.a. cursussen verzorgd in Bogota Colombia, Halfway House Zuid-Afrika, Bratislava Slowakije. Momenteel verzorgt hij trainingen bij Transfer Solutions in Leerdam, een ICT-bedrijf dat gespecialiseerd is in dienstverlening rond Oracle-databasesystemen en Java-technologie. Hij heeft zich de laatste jaren verdiept in transities, maatschappelijke transformatieprocessen, de S-curve en transities in relatie met beursindices. Linkedin: Wim Grommen

  • Lezing: De huidige crisis, een wetmatigheid?

    Op donderdag 13 februari bespreekt Wim Grommen de actuele problematiek die samenhangt met het ten einde lopen van de derde industriële revolutie. Deze lezing is gebaseerd op het paper van Wim Grommen ”The present crisis, a pattern: current problems associated with the end of the third industrial revolution” geschreven voor een International Symposium in Valencia: The Economic Crisis: Time for a paradigm shift. Grommen heeft op 25 januari 2013 tijdens het symposium in Valencia zijn paper aan mensen uit de wetenschap gepresenteerd.

    >> Klik hier voor meer informatie <<

    Over de lezing:

    Bijna dagelijks worden bedrijven en burgers geconfronteerd met de huidige crisis. Amper is er sprake van enig herstel of een volgend probleem moet worden opgelost. Niet alleen spaarders en beleggers hebben hierdoor geld verloren, ook bedrijven en de belastingbetaler moeten hun bijdrage leveren; zelfs de pensioenvoorziening van de burger komt onder grote druk te staan.

    Samenlevingen worden geconfronteerd met dezelfde problemen als aan het eind van de tweede industriële revolutie zoals oplopende werkloosheid, torenhoge schulden van bedrijven en overheden en dalende beursindexen. Kijkend naar de kenmerken van de fasen van transities, dit zijn maatschappelijke transformatieprocessen, zou het heel goed kunnen, dat we nu aan het eind van de zogenaamde derde industriële revolutie zijn aanbeland.

    Tijdens de lezing komen belangrijke kenmerken van transities aan de orde, het verloop van een transitie volgens de s-curve, de duur van transities en belangrijke transities die zich in de geschiedenis hebben voorgedaan en die grote invloed hebben gehad op onze leefomgeving. Er wordt aan de hand van grafieken van o.a. beursindexes, de schuldenlast van samenlevingen, salariëring in de financiële wereld aangetoond dat deze grafieken grote overeenkomsten hebben met de s-curves van de laatste twee industriële revoluties. Er wordt ook aandacht besteed aan beursindexen. Beursindexen, zoals de Dow Jones, zijn ideale transitiemeters, maar tevens fata morgana’s en zetten in feite samenlevingen op het verkeerde been.

    In de lezing staan vijf belangrijke pijlers van de eigen leefomgeving centraal. De historie heeft geleerd dat deze pijlers onontbeerlijk zijn voor een stabiele leefomgeving. De 5 pijlers voor een stabiele samenleving zijn kennis, welzijn, veiligheid, voedsel en gezondheid. Ook nu moeten we weer nadenken op welke wijze we deze pijlers in evenwicht kunnen houden. Wim gaat hierover graag de dialoog aan met het publiek!

    Over Wim Grommen:

    Wim Grommen was o.a. 6 jaar wiskunde/natuurlunde docent op het Norbertuscollege in Roosendaal. Gedurende 25 jaar gaf hij trainingen op het gebied van automatisering; Scheidegger in Venlo, BTA Bergen op Zoom en Oracle Nederland. Voor Oracle heeft hij o.a. cursussen verzorgd in Bogota Colombia, Halfway House Zuid-Afrika, Bratislava Slowakije. Momenteel verzorgt hij trainingen bij Transfer Solutions in Leerdam, een ICT-bedrijf dat gespecialiseerd is in dienstverlening rond Oracle-databasesystemen en Java-technologie. Hij heeft zich de laatste jaren verdiept in transities, maatschappelijke transformatieprocessen, de S-curve en transities in relatie met beursindices.

    Linkedin: Wim Grommen

    Publicaties

    Wim Grommen publiceerde de volgende artikelen op Marketupdate.

    Lezing Wim Grommen: De huidige crisis, een wetmatigheid?

    Lezing Wim Grommen: De huidige crisis, een wetmatigheid?

  • Kan de politiek een nieuwe beurscrash voorkomen?

    Dit artikel roept de politiek op, om in overleg met het bedrijfsleven, het splitsen van aandelen in de toekomst te verbieden. Dit artikel verklaart, waarom er tijdens de versnellingsfase van een industriële revolutie telkens veel aandelensplitsingen plaats vinden en dat aandelensplitsingen telkens de beurscrash versterken. Door het verbieden van aandelensplitsingen zal een beurscrash in de toekomst minder hevig zijn. Het eerste deel van dit artikel werd al beschreven in eerdere publicaties van Wim Grommen. Als u die al gelezen heeft kunt u beginnen bij het kopje ‘Aandelensplitsingen versterken beurshausse’.

    Door: Wim Grommen

    Transities

    Iedere productiefase, of iedere maatschappij of ander menselijk verschijnsel, doorloopt een zogenaamd transformatieproces. Transities zijn maatschappelijke transformatieprocessen, die tenminste één generatie beslaan. Transities hebben de volgende eigenschappen: - het betreft een structurele verandering van de (wereld)-maatschappij, of een complex deelsysteem daarvan; - er is sprake van op elkaar inwerkende en elkaar versterkende technologische, economische, ecologische, sociaal-culturele en institutionele ontwikkelingen op verschillende schaalniveaus; - het is de resultante van langzame veranderingen (ontwikkelingen in voorraden) en snelle dynamiek (stromen). Een transitie ligt niet bij voorbaat vast, omdat er gedurende een veranderingsproces altijd sprake is van aanpassen aan, leren van, en inspelen op nieuwe situaties. Een transitie is dus geen wetmatigheid.

    Vier transitiefasen

    In het algemeen beschrijven transities de S-curve en zijn vier transitiefasen te onderscheiden:
    1. Een voorontwikkelingsfase van dynamisch evenwicht waarin de status-quo niet zichtbaar verandert;
    2. Een ‘take-off’-fase waarin het veranderingsproces op gang komt, doordat de toestand van het systeem begint te verschuiven;
    3. Een versnellingsfase waarin zichtbaar structurele veranderingen plaatsvinden door een cumulatie van op elkaar inspelende sociaal-culturele, economische, ecologische en institutionele veranderingen; in de versnellingsfase is sprake van collectieve leerprocessen, diffusie en processen van inbedding;
    4. Een stabilisatiefase waarin de snelheid van maatschappelijke verandering afneemt en al lerend een nieuw dynamisch evenwicht wordt bereikt.
    Ook een productlevenscyclus en een bedrijfslevenscyclus beschrijven een S-curve. In dit geval is er nog een vijfde fase: de aftakelingsfase, waarin kosten stijgen door overcapaciteit en waarin een producent zich uiteindelijk terugtrekt uit de markt. Als we terugkijken in de geschiedenis, dan hebben in de laatste twee eeuwen drie ingrijpende transities (industriële revoluties) plaatsgevonden:
    1. De 1e industriële revolutie (1780 tot circa 1850); de stoommachine
    2. De 2e industriële revolutie (1870 tot circa 1930); elektriciteit, olie en auto
    3. De 3e industriële revolutie (1950 tot ....); computer en microprocessor

    Het ontstaan van een beurshausse

    In de voorontwikkelingsfase en take-off-fase van een industriële revolutie ontstaan er veel nieuwe bedrijven. Al deze bedrijven doorlopen min of meer gelijktijdig dezelfde levenscyclus. Tijdens de 2e industriële revolutie waren dit de bedrijven in de staal-, olie-, auto- en elektriciteitsindustrie. Tijdens de 3e industriële revolutie waren dit de bedrijven in de hardware-, software-, consultancy- en communicatieindustrie. Tijdens de versnellingsfase van een industriële revolutie bevinden veel van deze nieuwe bedrijven zich, min of meer gelijktijdig, in de versnellingsfase van hun levenscyclus (Figuur 1).

    Verloop van een marktontwikkeling

    Figuur 1: Verloop van een marktontwikkeling: introductie, groei, bloei en verval

    De verwachte waarde van de aandelen van deze bedrijven, die in de versnellingsfase van hun bestaan komen, stijgt enorm. Dit is de reden waarom aandelen in de versnellingsfase van een industriële revolutie erg duur worden. De koers-winstverhouding van aandelen is tussen 1920 – 1930, de versnellingsfase van de tweede industriële revolutie, enorm gestegen en ook tussen 1990 – 2000, de versnellingsfase van de derde industriële revolutie.

    Twee industriële revoluties: koers-winstverhouding

    Figuur 2: Twee industriële revoluties: koers-winstverhouding

    Aandelensplitsingen versterken beurshausse

    De stijging van de koers-winstverhouding wordt nog eens versterkt, doordat veel bedrijven tijdens de versnellingsfase van hun bestaan, besluiten hun aandelen te splitsen. Een aandelensplitsing is gewenst, als de beurswaarde van een aandeel te groot is geworden en daardoor de verhandelbaarheid onvoldoende is. Omdat er bij de lagere koers meer potentiële beleggers zijn, heeft een splitsing dus een positief effect op de waarde van het aandeel. Tussen 1927 - 1929 en 1990 – 2000 zijn er veel aandelensplitsingen geweest, die de koers-winstverhouding positief hebben beïnvloedt.

    tabel1-dowdivisor

    Tabel 1: Aandelensplitsingen voor de beurscrash van 1929

    tabel2-dowdivisor

    Tabel 2: Aandelensplitsingen tijdens de periode 1990 - 2000

    Aandelensplitsingen laten telkens Dow Jones Index exploderen

    De Dow Jones Index wordt voor het eerst gepubliceerd op 26 mei 1896. De index wordt berekend door de som van de aandelen te delen door 12:

    Dow_12_26_mei_1896 = (a1 + a2+ ..........+a12) / 12

    Op 4 oktober 1916 wordt de Dow uitgebreid naar 20 bedrijven; er verdwijnen 4 bedrijven en er komen 12 nieuwe bedrijven bij.

    Dow_20_4_okt_1916 = (a1 + a2+ ..........+a20) / 20

    Twee jaar voor de beurscrash oktober 1929, op 31 December 1927, werden van een aantal bedrijven voor het eerst de aandelen gesplitst. Bij elke wijziging in het mandje van de Dow Jones of bij een aandelensplitsing, wordt de formule waarmee de Dow Jones wordt berekend aangepast. Dit gebeurt omdat de index, de uitkomst van de twee formules van beide mandjes, op het moment van verandering dezelfde uitkomst moet opleveren. Voor die aandelen, die op 31 december 1927 worden gesplitst, wordt een wegingsfactor in de berekening meegenomen. De formule ziet er als volgt uit (American Can wordt met 6 vermenigvuldigd, General Electric met 4 enz).

    Dow_20_31_dec_1927 = (6.a1 + 4.a2+ ..........+a20) / 20

    Op 1 oktober 1928 wordt de Dow Jones verder uitgebreid naar 30 aandelen. Omdat men nog alles met de hand moet uitrekenen wordt de berekening van de index eenvoudiger. De wegingsfactor van de gesplitste aandelen verdwijnt en men introduceert de Dow Divisor. De index wordt berekend door de som van de aandelen te delen door de Dow Divisor. Omdat de index op 1 oktober 1928 niet mag veranderen, krijgt de Dow Divisor de waarde 16.67. De index-grafiek van de twee tijdsperioden moet per slot van rekening wel op elkaar aansluiten.

    Dow_30_1_okt_1928 = (a1 + a2+ ..........+a30) / 16.67

    In het najaar van 1928 en het voorjaar van 1929 vinden er 8 aandelensplitsingen waardoor de Dow Divisor daalt naar 10.77.

    Dow_30_25_juni_1929 = (a1 + a2+ ..........+a30) / 10.47

    Vanaf dat moment levert een waardestijging van de 30 aandelen bijna driemaal zoveel indexpunten op dan 31 december 1927. Bij de oude formule zou de som van de aandelen worden gedeeld door 30.

    Dow Jones index voor en na Black Tuesday

    Figuur 3: Dow Jones Index voor en na Black Tuesday

    De extreme stijging van de Dow Jones in de periode 1920 – 1929 en met name tussen 1927 – 1929, is dus vooral veroorzaakt omdat de verwachte waarde van de aandelen van bedrijven, die in de versnellingsfase van hun bestaan komen, enorm stijgt. De waardestijging van de aandelen wordt door aandelensplitsingen nog verder versterkt en als klap op de vuurpijl wordt deze waardestijging van de aandelen nog een keer uitvergroot in de Dow Jones Index, omdat achter de schermen bij aandelensplitsingen, de formule van de Dow Jones wordt aangepast. Tijdens de versnellingsfase van de derde industriële revolutie, 1990 - 2000, heeft de geschiedenis zich herhaald. In deze periode zijn er weer vele aandelensplitsingen geweest, m.n. in de jaren 1997 en 1999.

    Overzicht Dow Jones, Dow Divisor en aantal splitsingen tussen 1990 - 2000

    Tabel 3: Overzicht Dow Jones, Dow Divisor en aantal splitsingen tussen 1990 - 2000

    De formule die op 1 januari 1990 werd gebruikt om de Dow Jones te berekenen was:

    Dow_30_1_jan_1990 = (a1 + a2+ ..........+a30) / 0.586

    De formule die op 31 december 1999 werd gebruikt om de Dow Jones te berekenen was:

    Dow_30_31_dec_1999 = (a1 + a2+ ..........+a30) / 0.20145268

    Op 31 december 1999 levert een waardestijging van de 30 aandelen ook weer bijna driemaal zoveel indexpunten op als dezelfde waardestijging op 1 januari 1990! Ook nu weer is de extreme stijging van de Dow Jones in de periode 1990 – 2000 dus vooral veroorzaakt omdat de verwachte waarde van de aandelen van bedrijven, die in de versnellingsfase van hun bestaan komen, enorm stijgt. De waardestijging van de aandelen wordt door aandelensplitsingen nog verder versterkt en als klap op de vuurpijl wordt deze waardestijging van de aandelen nog een keer wordt uitvergroot in de Dow Jones Index, omdat achter de schermen de formule van de Dow Jones wordt aangepast.

    Historische grafiek Dow Jones index

    Figuur 4: Dow Jones Index tijdens 3e industriële revolutie

    Conclusie: Politiek moet splitsen van aandelen verbieden

    Door een verbod op aandelensplitsing zal een beurshausse tijdens de versnellingsfase van een industriële revolutie veel minder extreem zijn. De stabilisatiefase van een industriële revolutie kenmerkt zich, doordat de markt verzadigd raakt en de concurrentie toeneemt. Alleen de sterkste bedrijven kunnen de concurrentie aan, of nemen de concurrentie over. Hierbij komen veel van de nieuw ontstane bedrijven in de stabilisatiefase of aftakelingsfase van hun levenscyclus en zullen de groeimogelijkheden van deze bedrijven gaan afnemen en dus ook de verwachte waarde van de aandelen. De koers-winstverhouding van aandelen zal hierdoor gaan dalen. Deze trend heeft zich destijds vanaf 1930 ingezet en vanaf 2000 heeft het patroon zich weer herhaald. Door het verbieden van aandelensplitsingen zal de beurshausse minder extreem zijn, daardoor ook de dalende trend. Het is nu zaak dat zowel politiek als bedrijfsleven proactief gaan handelen; driemaal is scheepsrecht.

    Dow Divisor campagneZowel het artikel "1929: Beurscrash of correctie?" als het artikel “Kan de politiek een nieuwe beurscrash voorkomen?” zijn zowel naar de Tweede Kamercommissie voor Financiën als naar de Tweede Kamercommissie voor Economische Zaken gestuurd, met het verzoek, het splitsen van aandelen door bedrijven kritisch te bestuderen en hiertegen de juiste maatregelen te nemen.

  • 1929: Beurscrash of correctie?

    Dit artikel van Wim Grommen verklaart waarom de introductie van het splitsen van aandelen op 31 december 1927 uiteindelijk de beurscrash van 1929 heeft veroorzaakt. Het veelvuldig splitsen van aandelen, met zeer grote verhoudingen, heeft de beurshausse enorm aangewakkerd, waardoor de beurscrash van 1929 zeer heftig was. In zijn vorige bijdrage beschreef Grommen hoe transities en de vier transitiefasen die bijdragen aan een beurshausse, dat artikel kunt u hier teruglezen. In dit artikel staan we uitgebreid stil bij het effect van aandelensplitsingen.

    Het splitsen van aandelen wakkert koers-winstverhouding aan

    Een aandelensplitsing is het verlagen van de nominale waarde van een aandeel met een bepaalde factor, waartegenover dan meer aandelen worden uitgegeven, verhoogd met diezelfde factor. Kortweg gezegd als de nominale waarde met een factor 2 wordt verlaagd dan wordt het aantal aandelen met diezelfde factor 2 verhoogd. De totale waarde van het aandelenbezit dus blijft gelijk. Een aandelensplitsing is gewenst, als de beurswaarde van een aandeel te groot is geworden en daardoor de verhandelbaarheid onvoldoende is. Omdat er bij de lagere koers meer potentiële beleggers zijn, heeft een splitsing dus een positief effect op de waarde van het aandeel.

    De stijging van de koers-winstverhouding van aandelen wordt dus ook versterkt, doordat veel bedrijven tijdens de versnellingsfase van hun bestaan, besluiten hun aandelen te splitsen. Twee jaar voor de beurscrash (oktober 1929), op 31 december 1927, werd voor het eerst het splitsen van aandelen toegepast. Tussen 1927 - 1929 zijn van veel bedrijven de aandelen, met zeer grote verhoudingen, gesplitst (zie de lijst verderop in dit artikel). Deze splitsingen hebben de koers-winstverhouding van aandelen nog verder opgedreven.

    Koers-winstverhouding stijgt enorm tussen 1920 - 1930

    Figuur 2: Koers-winstverhouding stijgt enorm tussen 1920 - 1930

    Het splitsen van aandelen liet ook Dow Jones Index exploderen

    De Dow Jones Index wordt voor het eerst gepubliceerd op 26 mei 1896. De index wordt berekend door de som van de aandelen te delen door 12:
    • Dow_12_26_mei_1896 = (a1 + a2+ ..........+a12) / 12
    Op 4 oktober 1916 wordt de Dow uitgebreid naar 20 bedrijven; er verdwijnen vier bedrijven en er komen twaalf nieuwe bedrijven bij.
    • Dow_20_4_okt_1916 = (a1 + a2+ ..........+a20) / 20
    Op 31 december 1927 worden van een aantal bedrijven voor het eerst de aandelen gesplitst. Bij elke wijziging in de samenstelling van de Dow Jones of bij een aandelensplitsing, wordt de formule, waarmee de Dow Jones wordt berekend, aangepast. Dit gebeurt omdat de index, de uitkomst van de twee formules van beide mandjes, op het moment van verandering dezelfde uitkomst moet opleveren. Voor die aandelen, die op 31 december 1927 worden gesplitst, wordt in eerste instantie een wegingsfactor in de berekening meegenomen... Datum - Bedrijf - Splitsing
    • 31 december 1927 - American Can - 6 voor 1
    • 31 december 1927 - General Electric -4 voor 1
    • 31 december 1927 - Sears, Roebuck & Company - 4 voor 1
    • 31 december 1927 - American Car & Foundry- 2 voor 1
    • 31 december 1927 - American Tobacco- 2 voor 1
    • 5 november 1928 - Atlantic Refining- 4 voor 1
    • 13 december 1928 - General Motors - 2 1/2 voor 1
    • 13 december 1928 - International Harvester- 4 voor 1
    • 8 januari 1929 - American Smelting - 3 voor 1
    • 8 januari 1929 - Radio Corporation of America - 5 voor 1
    • 1 mei 1929 - Wright-Aeronautical - 2 voor 1
    • 20 mei 1929 - Union Carbide split - 3 voor 1
    • 25 juni 1929 - Woolworth split - 2 1/2 voor 1

    Nieuwe formule

    De formule ziet er dan als volgt uit (American Can, splitsing 6 voor 1, wordt met 6 vermenigvuldigd, General Electric, splitsing 4 voor 1, wordt met 4 vermenigvuldigd enz).
    • Dow_20_31_dec_1927 = (6.AC + 4.GE+ ..........+a20) / 20
    Op 1 oktober 1928 wordt de Dow Jones verder uitgebreid naar 30 aandelen. Omdat men nog alles met de hand moet uitrekenen wordt de berekening van de index eenvoudiger. De wegingsfactor van de gesplitste aandelen verdwijnt en men introduceert de Dow Divisor. De index wordt berekend door de som van de aandelen te delen door de Dow Divisor. Omdat de index op 1 oktober 1928 niet mag veranderen, krijgt de Dow Divisor de waarde 16.67. De index-grafiek van de twee tijdsperioden moet per slot van rekening wel op elkaar aansluiten.
    • Dow_30_1_okt_1928 = (a1 + a2+ ..........+a30) / 16.67
    In het najaar van 1928 en het voorjaar van 1929 (Zie tabel 1) vinden er nog 8 aandelensplitsingen waardoor de Dow Divisor daalt naar 10.77.
    • Dow_30_25_juni_1929 = (a1 + a2+ ..........+a30) / 10.77
    Vanaf 1 oktober 1928 levert een waardestijging van de 30 aandelen dus bijna tweemaal zoveel indexpunten op en vanaf 25 juni 1929 bijna driemaal zoveel indexpunten, vergeleken met een waardestijging van de 30 aandelen voor 31 december 1927. Bij de oude formule zou de som van de 30 aandelen worden gedeeld door 30.

    Dow Jones index voor en na Black Tuesday

    Figuur 3: Dow Jones Index voor en na Black Tuesday

    Van beurscrash 1929 naar beurscorrectie 1929

    De beurshausse in de periode 1920 – 1929 is uiteraard in eerste instantie veroorzaakt, doordat de verwachte waarde van de aandelen van bedrijven, die in de versnellingsfase van hun bestaan komen, enorm stijgt. Deze beurshausse werd echter door het introduceren van het splitsen van aandelen op 31 december 1927 enorm aangewakkerd. Als klap op de vuurpijl werd vanaf 1 oktober 1928, door wijzigingen in de formule van de Dow Jones, de waardestijging van aandelen nog verder uitvergroot. De beurscrash van oktober 1929 was waarschijnlijk veel minder heftig geweest, wanneer het splitsen van aandelen achterwege was gebleven (en dus ook de wijzigingen in de formule van de Dow Jones). Waarschijnlijk zou men dan tegenwoordig niet spreken over de beurscrash van 1929, maar over de beurscorrectie van 1929. Door: Wim Grommen

  • Beurshausse en beurscrash, oorzaak en gevolg

    Door: Wim Grommen

    Waardoor ontstaat er van tijd tot tijd een hausse op de aandelenmarkt? Dit artikel verklaart aan de hand van transitie-eigenschappen waarom er tijdens de versnellingsfase van een transitie een beurshausse ontstaat, die uiteindelijk in de stabilisatiefase van een transitie weer gevolgd zal worden door een beurscrash. Ik zal dit stap voor stap uitleggen.

    Transities

    Iedere productiefase, of iedere maatschappij of ander menselijk verschijnsel, doorloopt een zogenaamd transformatieproces. Transities zijn maatschappelijke transformatieprocessen, die tenminste één generatie beslaan.

    Transities hebben de volgende eigenschappen:

    • het betreft een structurele verandering van de (wereld)-maatschappij, of een complex deelsysteem daarvan
    • er is sprake van op elkaar inwerkende en elkaar versterkende technologische, economische, ecologische, sociaal-culturele en institutionele ontwikkelingen op verschillende schaalniveaus
    • het is de resultante van langzame veranderingen (ontwikkelingen in voorraden) en snelle dynamiek (stromen).

    Een transitie ligt niet bij voorbaat vast, omdat er gedurende een veranderingsproces altijd sprake is van het aanpassen aan, het leren van en het inspelen op nieuwe situaties. Een transitie is dus geen wetmatigheid.

    Vier transitiefasen

    In het algemeen beschrijven transities de S-curve en daarbij zijn er vier transitiefasen te onderscheiden:
    1. Een voorontwikkelingsfase van dynamisch evenwicht waarin de status-quo niet zichtbaar verandert.
    2. Een ‘take-off’-fase waarin het veranderingsproces op gang komt, doordat de toestand van het systeem begint te verschuiven.
    3. Een versnellingsfase waarin zichtbaar structurele veranderingen plaatsvinden door een cumulatie van op elkaar inspelende sociaal-culturele, economische, ecologische en institutionele veranderingen. In de versnellingsfase is sprake van collectieve leerprocessen, diffusie en processen van inbedding.
    4. Een stabilisatiefase waarin de snelheid van maatschappelijke verandering afneemt en al lerend een nieuw dynamisch evenwicht wordt bereikt.
    Ook een productlevenscyclus en een bedrijfslevenscyclus beschrijven een S-curve. In dit geval is er nog een vijfde fase: de aftakelingsfase, waarin kosten stijgen door overcapaciteit en waarin een producent zich uiteindelijk terugtrekt uit de markt. Als we terugkijken in de geschiedenis, dan hebben in de laatste twee eeuwen drie ingrijpende transities (industriële revoluties) plaatsgevonden:
    1. De 1e industriële revolutie (1780 tot circa 1850); de stoommachine
    2. De 2e industriële revolutie (1870 tot circa1930); electriciteit, olie en auto
    3. De 3e industriële revolutie (1950 tot ....); computer en microprocessor

    Het ontstaan van een beurshausse

    In de voorontwikkelingsfase en take-off-fase van een industriële revolutie ontstaan er veel nieuwe bedrijven. Al deze bedrijven doorlopen min of meer gelijktijdig dezelfde levenscyclus. Tijdens de tweede industriële revolutie waren dit de bedrijven in de staal-, olie-, auto- en elektriciteitsindustrie. Tijdens de derde industriële revolutie waren dit de bedrijven in de hardware-, software-, consultancy- en communicatie-industrie. Tijdens de versnellingsfase van een industriële revolutie bevinden veel van deze nieuwe bedrijven zich, min of meer gelijktijdig, in de versnellingsfase van hun levenscyclus (zie Figuur 1).

    Verloop van een marktontwikkeling: introductie, groei, bloei en verval

    Figuur 1: Verloop van een marktontwikkeling: introductie, groei, bloei en verval

    De verwachte waarde van de aandelen van bedrijven die in de versnellingsfase van hun bestaan komen stijgt enorm. Dit is de reden waarom aandelen in de versnellingsfase van een industriële revolutie erg duur worden. De koers-winstverhouding van aandelen is tussen 1920 – 1930 (de versnellingsfase van de 2e industriële revolutie) enorm gestegen. Ook tussen 1990 – 2000 (de versnellingsfase van de 3e industriële revolutie) zagen we deze trend. De stijging van de koers-winstverhouding wordt nog eens versterkt doordat veel bedrijven, tijdens de versnellingsfase van hun bestaan, besluiten hun aandelen te splitsen. Een aandelensplitsing is gewenst zodra de beurswaarde van een aandeel zo groot is geworden dat ze daardoor minder goed verhandelbaar is. Omdat er bij de lagere koers meer potentiële beleggers kunnen kopen, heeft een splitsing dus een positief effect op de waarde van het aandeel. Tussen 1920 - 1930 en 1990 – 2000 zijn er enorm veel aandelensplitsingen geweest, die de koers-winstverhouding positief hebben beïnvloed. Tijdens de versnellingsfase van een industriële revolutie zal er dus altijd een beurshausse ontstaan.

    Twee industriële revoluties: koers-winstverhouding

    Figuur 2: Twee industriële revoluties: koers-winstverhouding

    Het gevolg van een beurshausse is een beurscrash

    De stabilisatiefase van een industriële revolutie kenmerkt zich, doordat de markt verzadigd raakt en de concurrentie toeneemt. Alleen de sterkste bedrijven kunnen de concurrentie aan, of nemen de concurrentie over. Hierbij komen veel van de nieuw ontstane bedrijven in de stabilisatiefase of aftakelingsfase van hun levenscyclus en zullen de groeimogelijkheden van deze bedrijven gaan afnemen en dus ook de verwachte waarde van de aandelen. De koers-winstverhouding van aandelen zal hierdoor gaan dalen. Deze trend heeft zich destijds vanaf 1930 ingezet en vanaf 2000 heeft het patroon zich weer herhaald. De toekomst zal ons - mede afhankelijk van het gedrag van de centrale banken - leren of en in welk tempo de koers/winstverhouding van aandelen nog verder zal dalen. Aristoteles’s wet van oorzaak en gevolg geldt voor een beurshausse en een beurscrash. Lees meer artikel van Wim Grommen op Marketupdate

    ~~~~

    DOWDIVISOR30

    Wim Grommen heeft eerder dit jaar een internationale campagne gelanceerd, genaamd DOWDIVISOR30. Deze campagne is bedoeld om degenen die verantwoordelijk zijn voor de samenstelling van de Dow Jones te overtuigen dat de Dow Divisor in de formule waarmee Dow Jones wordt berekend, op korte termijn weer zijn oorspronkelijke waarde moet krijgen, namelijk 30. Degenen die verantwoordelijk zijn, zijn een aantal journalisten van de Wall Street Journal en de eigenaar van de Dow Jones Index, het bedrijf S & P Dow Jones Indices LLC, een dochteronderneming van The McGraw-Hill Companies. Burgers kunnen wereldwijd een petitie tekenen die de regering van de president Obama vraagt om druk uit te oefenen op de betreffende journalisten en het bedrijf S & P Dow Jones Indices LLC om deze wijziging in de formule van de Dow Jones door te voeren.

    Voor meer informatie over deze campagne, klik hier!

  • Dow Jones Index krijgt weer epo en groeihormonen toegediend

    Op 23 september krijgt de Dow de grootste facelift sinds 2004 als in één klap drie hoofdfondsen worden vervangen. Hewlett-Packard Co., Bank of America Inc. en Alcoa Inc. , de losers, worden vervangen door Goldman Sachs Group Inc., Nike Inc. en Visa Inc. De herziening van de aandelen van de Dow Jones toont weer aan hoe de Dow Jones Index gemanipuleerd wordt, zodat deze index op lange termijn blijft stijgen. Zwakkere aandelen worden vervangen door populaire aandelen (losers out, winners in).

    Wat nog opvallender is dat de drie bedrijven die uit de index verdwijnen een lage beurskoers hebben, terwijl de drie aandelen die er voor in de plaats komen een hoge beurskoers hebben. Uiteraard is er de Dow Divisor die ervoor zorgt dat de waarde van de Dow Jones met de nieuwe aandelen dezelfde is als de waarde van de Dow Jones met de oude aandelen. Dit heeft echter slechts effect op korte termijn, op lange termijn weegt de winst van de hoge beurskoersen echter veel zwaarder.

    Drie nieuwe aandelen zorgen voor bijna 8x meer punten in de Dow Jones

    De Dow Jones Index wordt berekend door de som van 30 aandelen te delen door Dow Divisor. Op 10 september eindigde de Dow Jones op 15191 punten. De Dow Divisor heeft momenteel een waarde van 0,130216081. Dit betekent dat de huidige som van de 30 aandelen een waarde heeft van $1.978 .

    HP noteert aan een koers van $22, Bank of America aan $14 en Alcoa aan $ 8. Deze aandelen worden dus vervangen door Goldman Sachs aan $164, Nike aan $67 en Visa aan $184. Er verdwijnt voor $44 uit de Dow Jones en er komt voor $415 aan aandelen in de plaats, dit is bijna het tienvoudige. Dit betekent dat de nieuwe som van de 30 aandelen een waarde krijgt van $2349 (1978 – 44 + 415 ). Om weer op 15191 indexpunten uit te komen zal de Dow Divisor vermoedelijk aangepast worden van 0,130216081 naar 0,154631.

    • Als de oude drie aandelen ieder met 10 % zouden stijgen, zou dit 4,4 /130216081 = 33,80 punten hebben bijgedragen tot de stijging van de Dow Jones.
    • Als de nieuwe drie aandelen met 10 % stijgen, zal dit 41,5/0,154631 of 268,4 punten bijdragen tot de stijging van de Dow Jones.

    De invloed van de 3 losers was: $ 44 van $ 1978 is 2,2% op de Dow Jones Index.

    De invloed van de 3 winners wordt: $ 415 of $ 2349 is 17,67% op the Dow Jones Index.

    Dit stinkt behoorlijk naar manipulatie, dubbele manipulatie!

    Overzicht vanaf 2000: winners in, losers out

    23 september 2013:

    Hewlett-Packard Co., Bank of America Inc. en Alcoa Inc. worden vervangen door Goldman Sachs Group Inc., Nike Inc. en Visa Inc. Alcoa is vanaf 2007 van $40 naar $8,08 gezakt. Hewlett-Packard Co is vanaf 2010 van $50 naar $22,36 gezakt. Bank of America is vanaf 2007 van $50 naar $14,48 gezakt.

    Goldman Sachs Group Inc., Nike Inc. en Visa Inc zijn in 2013 respectievelijk 25%, 27% en 18% gestegen.

    20 september 2012: UnitedHealth Group Inc. (UNH) vervangt Kraft Foods Inc.
    Kraft Foods Inc werd opgesplitst in twee bedrijven en was niet meer geschikt voor de Dow.

    Het aandeel van UnitedHealth Group Inc was 2 jaren voor toevoeging aan de Dow met 53% gestegen.

    8 juni 2009: Cisco en Travelers vervangen Citigroup en General Motors.
    Citigroup en General Motors hebben miljarden dollars van de Amerikaanse regering ontvangen om te overleven en waren niet meer representatief voor de Dow.

    22 september 2008: Kraft Foods Inc. vervangt American International Group.
    American International Group wordt vervangen na het besluit van de regering om een 79,9%-belang in de verzekeringsreus te nemen. AIG werd ternauwernood van de ondergang gered door een noodlening van de Fed.

    19 februari 2008: Bank of America Corp. en Chevron Corp. vervangen Altria Group Inc. en Honeywell International. Altria werd opgesplitst in twee bedrijven en was niet meer geschikt voor de Dow. Honeywell werd uit de Dow verwijderd, omdat de rol van de industriële bedrijven in de Amerikaanse aandelenmarkt in de afgelopen jaren is afgenomen en Honeywell de kleinste omzet en winst had onder de deelnemers in de Dow.

    8 april 2004: Verizon Communications Inc., American International Group Inc. en Pfizer Inc. vervangen AT&T Corp ., Eastman Kodak Co. en International Paper.

    AIG aandelen waren tot meer dan 387 procent in het afgelopen decennium gestegen en Pfizer had een stijging van meer dan 675 procent achter de rug. Aandelen van AT & T en Kodak, daarentegen, hadden een daling van meer dan 40 procent in het afgelopen decennium en werden uit de Dow gehaald.

    Dow Jones Index is een fata morgana

    In veel grafieken is de y-as een vaste eenheid, zoals kg, meter, liter of euro. Bij deze index-grafieken lijkt dit ook zo, want op de y-as wordt de eenheid in punten gebruikt. Niets is echter minder waar! Een index-punt is namelijk geen vaste eenheid in de tijd en je mag er dan ook historisch gezien geen enkele betekenis aan hechten. Een index wordt berekend aan de hand van een mandje aandelen. Bij elke index gebeurt dat volgens een bepaalde formule en de uitkomst van de formule levert een aantal punten op. Een grote fout die veel mensen maken is dat er waarde gehecht wordt aan deze grafieken. Deze grafieken zijn echter erg bedrieglijk.

    • Een index wordt berekend aan de hand van een mandje aandelen. Bij elke index gebeurt dat volgens een bepaalde formule en als uitkomst krijg je dan een aantal punten. Dat mandje van aandelen wordt bij elke index echter regelmatig veranderd. Voor de nieuwe periode wordt dus de waarde van een ander mandje aandelen gemeten. Het is natuurlijk vreemd dat je de verschillende mandjes als zelfde eenheid projecteert.In minder dan 10 jaar tijd zijn 12 van de 30 bedrijven, dus 40%, van de Dow Jones vervangen. Over een periode van 16 jaar werden 20 bedrijven vervangen, dus 67%. Na een bepaalde periode wordt dus al snel de waarde van een mandje appels vergeleken met de waarde van een mandje peren.
    • Het wordt nog vreemder als bij elke overgang van mandjes ook nog eens de formule waarmee de index wordt berekend, verandert. Dit gebeurt omdat de index, de uitkomst van de twee formules van beide mandjes, op het moment van verandering dezelfde uitkomst moet opleveren. De index-grafiek van de twee tijdsperioden moet per slot van rekening wel op elkaar aansluiten. Bij de Dow Jones bijvoorbeeld, worden alle koersen van de dertig Dow-aandelen bij elkaar opgeteld en vervolgens door een getal gedeeld. Door wijzigingen in het mandje en door aandelensplitsingen wordt de deler telkens veranderd. De deler bedraagt momenteel 0.130216081, maar in 1985 was de deler nog meer dan 1. Een indexpunt in de ene periode wordt dus op een hele andere manier berekend dan in een andere periode:

    Dow1985 = (x1 + x2 + ……..+x30) / 1

    Dow2013 = (x1 + x2 + …….. + x30) / 0.130216081

    Exponentiële stijging Dow Jones index

    In de jaren 90 van de vorige eeuw zijn er veel aandelensplitsingen geweest. Om de breuk gelijk te houden is zowel de teller als de noemer van de breuk veranderd. Een koersstijging van 1 dollar van het mandje in 2013 levert dus de facto 7,7 meer indexpunten dan in 1985. Omdat er in de jaren 90 nogal wat aandelensplitsingen zijn geweest, is dit waarschijnlijk de oorzaak waarom de Dow Jones in deze periode bijna exponentieel is gestegen. Momenteel staat de Dow op 15191. Bij het hanteren van de formule uit 1985 zou de index nu op 1978 staan.

    • Het meest vreemde is natuurlijk de steeds wijzigende samenstelling van het mandje. Over het algemeen is het zo dat bij het wijzigen van het mandje, bedrijven die in een stabilisatiefase of de aftakelingsfase van hun cyclus zitten, uit het mandje gehaald worden. Bedrijven die in de ‘take-off’-fase of versnellingsfase van hun cyclus zitten worden toegevoegd. De kans dat de index na de wijziging van het mandje en de formule stijgt, is dan natuurlijk vele malen groter dan dat de index gaat dalen. Daar hoef je geen kansberekening op los te laten, met name als deze methode wordt toegepast in de versnellingsfase van een transitie. Vanaf 1980 zijn 7 ICT-bedrijven ( 3M, AT&T, Cisco, H P, IBM, Intel, Microsoft), de motoren van de laatste revolutie toegevoegd aan de Dow Jones en 5 financiële instellingen, deze spelen een belangrijke rol bij elke transitie.

    Echte waarheid en fictieve waarheid

    Het aantal punten dat de Dow Jones momenteel weergeeft, is gecreëerde waarheid, of te wel fictieve waarheid. Het aantal punten zegt absoluut niks over de staat waarin een samenleving verkeert. Dan je kun beter kijken naar het aantal mensen die in de samenleving gebruik moeten maken van voedselbonnen. Dat is de echte waarheid.

    Wim Grommen


    DOWDIVISOR30

    Wim Grommen heeft onlangs een internationale campagne gelanceerd, genaamd DOWDIVISOR30. Deze campagne is bedoeld om degenen die verantwoordelijk zijn voor de samenstelling van de Dow Jones te overtuigen dat de Dow Divisor in de formule waarmee Dow Jones wordt berekend, op korte termijn weer zijn oorspronkelijke waarde moet krijgen, namelijk 30. Degenen die verantwoordelijk zijn, zijn een aantal journalisten van de Wall Street Journal en de eigenaar van de Dow Jones Index, het bedrijf S & P Dow Jones Indices LLC, een dochteronderneming van The McGraw-Hill Companies. Burgers kunnen wereldwijd een petitie tekenen die de regering van de president Obama vraagt om druk uit te oefenen op de betreffende journalisten en het bedrijf S & P Dow Jones Indices LLC om deze wijziging in de formule van de Dow Jones door te voeren.

    — Voor meer informatie over deze campagne, klik hier —