The Dow Jones Industrial Average (DJIA) Index is the only stock market index that covers both the second and the third industrial revolution. Calculating share indexes such as the Dow Jones Industrial Average and showing this index in a historical graph is a useful way to show which phase the industrial revolution is in. Changes in the DJIA shares basket, changes in the formula and stock splits during the take-off phase and acceleration phase of industrial revolutions are perfect transition-indicators. The similarities of these indicators during the last two revolutions are fascinating, but also a reason for concern. In fact the graph of the DJIA is a classic example of fictional truth, a fata morgana.
Transitions
Every production phase, civilization or other human invention goes through a so called transformation process. Transitions are social transformation processes that cover at least one generation. In this article I will use one such transition to demonstrate the position of our present civilization and its possible effect on stock exchange rates.
A transition has the following characteristics:
- It involves a structural change of civilization or a complex subsystem of our civilization
- It shows technological, economical, ecological, socio cultural and institutional changes at different levels that influence and enhance each other
- It is the result of slow changes (changes in supplies) and fast dynamics (flows)
A transition process is not fixed from the start because during the transition processes will adapt to the new situation. A transition is not dogmatic.
Four transition phases
In general transitions can be seen to go through the S curve and we can distinguish four phases (see fig. 1):
- A pre development phase of a dynamic balance in which the present status does not visibly change
- A take off phase in which the process of change starts because of changes in the system
- An acceleration phase in which visible structural changes take place through an accumulation of socio cultural, economical, ecological and institutional changes influencing each other; in this phase we see collective learning processes, diffusion and processes of embedding
- A stabilization phase in which the speed of sociological change slows down and a new dynamic balance is achieved through learning
A product life cycle also goes through an S curve. In that case there is a fifth phase:
5. the degeneration phase in which cost rises because of over capacity and the producer will finally withdraw from the market.

Figure 1. The S curve of a transition
Four phases in a transition best visualized by means of an S curve:
Pre-development, Take-off, Acceleration, Stabilization.
When we look back into the past we see three transitions, also called industrial revolutions, taking place with far-reaching effect :
- The first industrial revolution (1780 until circa 1850); the steam engine
- The second industrial revolution (1870 until circa 1930); electricity, oil and the car
- The third industrial revolution (1950 until ....); computer and microprocessor
Dow Jones Industrial Average (DJIA)
The Dow Jones Industrial Average (DJIA) index is the oldest shares index in the United States. A select group of journalists of The Wall Street Journal decide which companies are included in the most influential stock exchange index in the world. Unlike most other indices the Dow is a price average index. This means that shares with a high price have a great influence on the movements of the index. Calculating stock index values such as the Dow and presenting the index in a historical graphs is a perfect way of indicating which phase an industrial revolution is in.
The Dow was first published in 1896. The index was calculated by dividing the sum of the shares by 12:
Dow-index_1896 = (x1 + x2+ ..........+x12) / 12
An index is calculated on the basis of a set of shares. Every index has its own formula and the formula results in the number of points of the index. However, this set of shares changes regularly. It is therefore very strange that different sets of shares are represented by the same unit.
After a period of 25 years the value of the original set of 12 apples is compared to the value of a set of 30 pears. In 1929 only 2 of the original 12 companies of the Dow were still present.
The most remarkable characteristic is of course the constantly changing set of shares. Generally speaking, the companies that are removed from the set are in a stabilization or degeneration phase. Companies in a take off phase or acceleration phase are added to the set. This greatly increases the chance that the index will rise rather than go down. This is obvious, especially when this is done during the acceleration phase of a transition. In 1916 the Dow was extended to 20 companies; 4 companies were taken out and 12 were added.
Dow-index_1916 = (x1 + x2+ ..........+x20) / 20
This way of calculating the index actually creates a kind of pyramid scheme. All goes well as long as companies are added that are in their take off phase or acceleration phase. At the end of a transition there will be fewer companies in those phases.
The shares of a number of companies were split during the years and for those shares a factor was added to the calculation. The formula is as follows (American Can is multiplied by 6, General Electric by 4).
Dow-index_1927 = (6.x1 + 4.x2+ ..........+x20) / 20
Things take a bizarre turn with the changes to the Dow Jones of 1 October 1928.
On 1 October 1928 the Dow Jones is enlarged to 30 shares.
Because all calculations are done by hand, the calculation formula of the index is simplified. The Dow Divisor is introduced. The index is calculated by dividing the sum of the share values using the Dow Divisor.
Because the value on 1 October 1928 must remain the same, the Dow Divisor is set at 16.67. The index graphs of before and after 1 October be a continuous line.
Dow-index_okt_1928 = (x1 + x2+ ..........+x30) / 16.67
On 1 October 1928 the value of the Dow is 239, so the sum of the shares is 3984 dollars. From that moment on an increase (or decrease) of the set of shares results in almost twice as many (or fewer) index points. In the old formula the sum would have been divided by 30.
With every change in the set of shares used to calculate the Dow, the value of the Dow Divisor also changes. This is done because the index which is the result of two different sets of shares at the moment the set is changed must be the same for both sets at that point in time. The same thing happens when shares are split. In the fall of 1928 and spring of 1929 8 shares are split decreasing the Dow Divisor to 10.47.
Dow-index_sept_1929 = (x1 + x2+ ..........+x30) / 10.47
From that moment on a an increase (or decrease) of the set of shares results in almost three times as many (or fewer) index points as a year before. In the old formula the sum would have been divided by 30. The Dow’s highest point is on 3 September 1929 at 381 points.
So the extreme increase followed by an extreme decrease of the Dow in the period 1920 – 1932 was primarily caused by changes to the formula, the constant changes to the set of shares during the acceleration phase of the second industrial revolution and splitting of s`hares during this period. Because of these changes in the Dow investors were wrong footed. The companies whose shares constituted the Dow index at that time also continued into the stabilization and degeneration phase.
The Dow Jones Industrial Index: a fata morgana
In many graphs the y-axis is a fixed unit, such as kg, meter, liter or euro. In the graphs showing the stock exchange values, this also seems to be the case because the unit shows a number of points. However, this is far from true! An index point is not a fixed unit in time and does not have any historical significance. An index is calculated on the basis of a set of shares. Every index has its own formula and the formula gives the number of points of the index. Unfortunately many people attach a lot of value to these graphs which are, however, very deceptive.
An index is calculated on the basis of a set of shares. Every index has its own formula and the formula results in the number of points of the index. However, this set of shares changes regularly. For a new period the value is based on a different set of shares. It is very strange that these different sets of shares are represented as the same unit. In less than ten years twelve of the thirty companies (i.e. 40%) in the Dow Jones were replaced. Over a period of sixteen years, twenty companies were replaced, a figure of 67%. This meant that over a very short period we were left comparing a basket of today’s apples with a basket of yesterday’s pears.
Even more disturbing is the fact that with every change in the set of shares used to calculate the number of points, the formula also changes. This is done because the index, which is the result of two different sets of shares at the moment the set is changed, must be the same for both sets at that point in time. The index graphs must be continuous lines. For example, the Dow Jones is calculated by adding the shares and dividing the result by a number. Because of changes in the set of shares and the splitting of shares the divider changes continuously. At the moment the divider is 0.15571590501117 but in 1985 this number was higher than 1. An index point in two periods of time is therefore calculated in different ways:
Dow1985 = (x1 + x2 +..+x30) / 1
Dow2014 = (x1 + x2 +.. + x30) / 0.15571590501117
In the 1990s many shares were split. To make sure the result of the calculation remained the same both the number of shares and the divider changed. An increase in share value of 1 dollar of the set of shares in 2014 results is 6.4 times more points than in 1985. The fact that in the 1990s many shares were split is probably the cause of the exponential growth of the Dow Jones index. At the moment the Dow is at 16,437 points. If we used the 1985 formula it would be at 2,559 points.
The most remarkable characteristic is of course the constantly changing set of shares. Generally speaking, the companies that are removed from the set are in a stabilization or degeneration phase. Companies in a take off phase or acceleration phase are added to the set. This greatly increases the chance that the index will rise rather than go down. This is obvious, especially when this is done during the acceleration phase of a transition. From 1980 onward 7 ICT companies (3M, AT&T, Cisco, HP, IBM, Intel, Microsoft), the engines of the latest revolution and 5 financial institutions, which always play an important role in every transition, were added to the Dow Jones.

Table 1. Changes in the Dow, stock splits and the value of the Dow Divisor after the market crash of 1929
Dow Jones Industrial Average

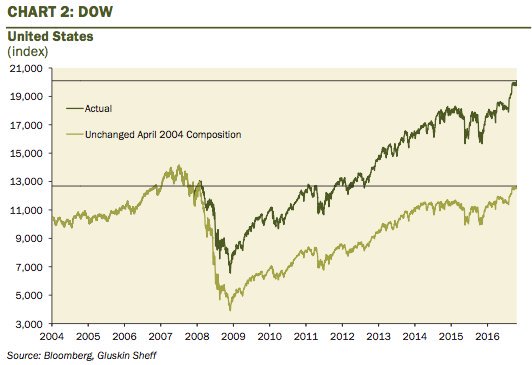
Figure 2 Exchange rates of Dow Jones during the latest two industrial revolutions. During the last few years the rate increases have accelerated enormously.
Double manipulation
On September 23 2013, the Dow got the biggest facelift since 2004 in one fell swoop with the removal of 3 company constituents:
Hewlett- Packard Co. (+21.5% ytd), Bank of America Inc. (+52.0% ytd) and Alcoa Inc. (-1.8% ytd)
And the addition of: Goldman Sachs Group Inc. (+25 ytd), Nike Inc. (+27% ytd) and Visa Inc. (+18% ytd)
What is even more striking is that the three companies removed from the index have a low share price (HP is trading at an approximate price of $22, BoA at $14 and Alcoa at $8 for a sum total of $44) while the three stocks added have a high market price (Goldman Sachs at $164, Nike at $67 and Visa at $184 for a sum total of $415). Of course there is the Dow Divisor which supposedly ensures that the value of the Dow Jones with the new shares is the same as the value of the Dow Jones with the old shares but this effect is only short-term as, in the long-term, the profits of the higher priced stocks will be greater/stronger than those of the weaker stocks that they replaced.
The Dow 30 is calculated by dividing the sum of the 30 constituents’ shares by the Dow Divisor. On September 10, the Dow Jones ended at 15,191 points. The Dow Divisor currently has a value of 0.130216081. This means that the current total of 30 shares is worth $1,978 (15,191 x 0.130216081=$1,978).
HP is trading at an approximate price of $22, BoA at $14 and Alcoa at $8 (sum total of $44). These shares will be replaced by Goldman Sachs at $164, Nike at $67 and Visa at $184 (sum total of $415) which is 9.4 times more. This means that the new sum of the 30 stocks have a value of $2,349 (1978 – 44 + 415) and, therefore we expect that the Dow Divisor will be adjusted from 0.130216081 to 0.154631 to get back to the original 15,191 index points (15,191 x 0.154631 = $2,349).
Given the above, had the three old shares increased by 10% each in price in the past the Dow 30 would have increased by 33.8 points in total (10% x 44 divided by 0.130216081 = 33.79 points) assuming there was no change in the price of the other 27 stocks.
As of September 23rd, however, a corresponding 10% increase in the price of each of the new shares would contribute 268.4 points to the rise of the Dow 30 (10% x 415 divided by 0.154631 = 268.38) or 7.94 times more points.
The influence of the 3 losers was: $44 of $1978. This is 2.2% of the Dow Jones Index.
The influence of the 3 winners becomes: $415 of $2,349. This is 17.67% of the Dow Jones Index.
This stinks pretty much of manipulation, even double manipulation!
Overview from 1997 : 20 winners in – 20 losers out, a figure of 67%
September 23, 2013: Hewlett – Packard Co., Bank of America Inc. and Alcoa Inc. replaced Goldman Sachs Group Inc., Nike Inc. and Visa Inc.
Alcoa has dropped from $40 in 2007 to $8.08. Hewlett- Packard Co. has dropped from $50 in 2010 to $22.36. Bank of America has dropped from $50 in 2007 to $14.48.
But Goldman Sachs Group Inc., Nike Inc. and Visa Inc. have risen 25%, 27% and 18% respectively in 2013.
September 20, 2012: UnitedHealth Group Inc. (UNH) replaces Kraft Foods Inc.
Kraft Foods Inc. was split into two companies and was therefore deemed less representative so no longer suitable for the Dow. The share value of UnitedHealth Group Inc. had risen for two years before inclusion in the Dow by 53%.
June 8, 2009: Cisco and Travelers replaced Citigroup and General Motors.
Citigroup and General Motors have received billions of dollars of U.S. government money to survive and were not representative of the Do.
September 22, 2008: Kraft Foods Inc. replaced American International Group.
American International Group was replaced after the decision of the government to take a 79.9% stake in the insurance giant. AIG was narrowly saved from destruction by an emergency loan from the Fed.
February 19, 2008: Bank of America Corp. and Chevron Corp. replaced Altria Group Inc. and Honeywell International.
Altria was split into two companies and was deemed no longer suitable for the Dow.
Honeywell was removed from the Dow because the role of industrial companies in the U.S. stock market in the recent years had declined and Honeywell had the smallest sales and profits among the participants in the Dow.
April 8, 2004: Verizon Communications Inc., American International Group Inc. and Pfizer Inc. replace AT & T Corp., Eastman Kodak Co. and International Paper.
AIG shares had increased over 387% in the previous decade and Pfizer had an increase of more than 675& behind it. Shares of AT & T and Kodak, on the other hand, had decreases of more than 40% in the past decade and were therefore removed from the Dow.
November 1, 1999: Microsoft Corporation, Intel Corporation, SBC Communications and Home Depot Incorporated replaced Chevron Corporation, Goodyear Tire & Rubber Company, Union Carbide Corporation and Sears Roebuck.
March 17, 1997: Travelers Group, Hewlett-Packard Company, Johnson & Johnson and Wal-Mart Stores Incorporated replaced Westinghouse Electric Corporation, Texaco Incorporated, Bethlehem Steel Corporation and Woolworth Corporation.
Real truth and fictional truth
Is the number of points that the Dow Jones now gives us a truth or a fictional truth?
If a fictional truth then the number of points now says absolutely nothing about the state that the economy or society is in when compared to the past. In that case a better guide would be to look at the number of people in society that use food stamps today – That is the real truth

Anthony Freda
Mr. Grommen was a teacher in mathematics and physics for eight years at secondary schools. The last twenty years he trained programmers in Oracle-software. The last years he studied transitions, social transformation processes, the S-curve and transitions in relation to market indices. Articles about these topics have been published in various magazines / sites in The Netherlands and Belgium.